Summary:
A new study published in Aging introduces EpiAgePublic, a next-generation sequencing-based method that accurately estimates biological age using only three key DNA sites in the ELOVL2 gene, offering a simpler and cost-effective alternative to traditional aging assessments.
Takeaways:
- Simplified Aging Assessment: EpiAgePublic requires analyzing only three DNA sites, making it a faster and more accessible method for measuring biological age.
- Clinical and Research Benefits: The test works with saliva samples, providing a non-invasive alternative to blood-based tests and broadening its applications in healthcare and longevity research.
- Potential for Early Disease Detection: This method can help identify factors accelerating aging, such as chronic illness and stress, and may assist in detecting age-related diseases earlier.
A new research paper was published in Aging (Aging-US) on January 22, 2025, in Volume 17, Issue 1, titled “EpiAge: a next-generation sequencing-based ELOVL2 epigenetic clock for biological age assessment in saliva and blood across health and disease.”
The research team, experts from both industry (EpiMedTech Global, HKG Epitherapeutics Ltd) and academic institutions (McGill University, Oxford University, University of Catania, and the Research Institute-IRCCS), led by first author David Cheishvili and corresponding author Moshe Szyf, have developed EpiAgePublic, a new method to estimate biological age using only three key DNA sites in the ELOVL2 gene, a well-known marker of aging. Unlike traditional methods that require analyzing thousands of DNA regions, this approach simplifies the process while maintaining accuracy. Their findings show that EpiAgePublic performs as well as, or even better than, more complex models in predicting biological age in diverse populations.
Biological Age Measures Speed Body Is Aging
Biological age measures how fast or slow a person’s body is aging. It can be different from chronological age and is influenced by genetics, lifestyle, and health conditions. Understanding biological aging can help researchers and clinicians identify age-related diseases like Alzheimer’s disease and develop anti-aging treatments. However, many existing biological age tests rely on expensive and complicated processes. The EpiAgePublic model overcomes these challenges with a simple yet powerful approach.
The study analyzed data from over 4,600 individuals across different health conditions, including Alzheimer’s disease and HIV. It confirmed that EpiAgePublic accurately tracks aging patterns and can identify factors such as chronic illness or stress that accelerate the aging process. Importantly, the researchers demonstrated that the test works well using saliva samples, offering a convenient and non-invasive alternative to blood-based tests. This makes it easier to conduct epigenetic age testing in both clinical and research settings.
Significant Health Implications
The ability to measure epigenetic aging with a quick and cost-effective test has significant implications for healthcare, longevity research, and personalized medicine. This method could be used in hospitals, wellness clinics, and longevity studies to track aging and evaluate the effectiveness of anti-aging interventions. It may also help clinicians detect early signs of aging-related diseases, allowing for better preventive care.
Finally, the study’s findings highlight the advantages of next-generation sequencing in epigenetic research, leading the way for more precise and accessible aging diagnostics. Future research will explore how this model can be expanded to other health conditions and used in routine medical practice.
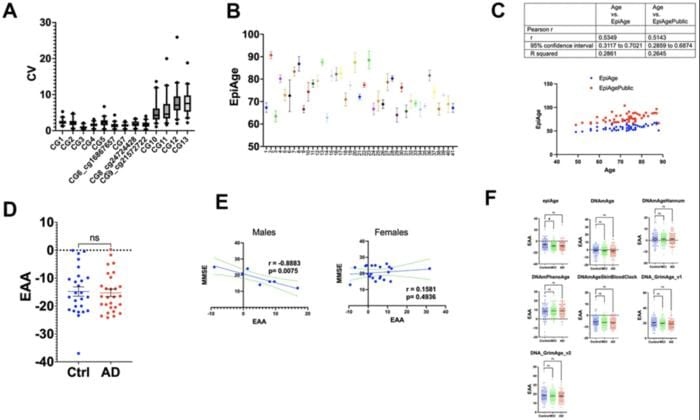
Featured Image: (A) Box plots of coefficient of variation (CV) for methylation levels across 13 CpG sites. This figure illustrates the distribution of the coefficient of variation (CV) for each of the 13 CpG sites within the ELOVL2 gene, analyzed using next-generation sequencing. The CV was calculated by dividing the standard deviation of methylation measurements by the mean for each site, expressed as a percentage. The box plots show the interquartile range (25th to 75th percentile) with whiskers extending to the 5th and 95th percentiles. Sites 1-9 exhibit lower CVs, ranging from 0.28% to 6.7%, indicative of high methylation consistency. Sites 10-13 display higher CVs, ranging from 1% to 25%, reflecting increased variability in regions of lower methylation. This variability highlights the influence of methylation levels on the precision of epigenetic age assessments. (B) The figure displays a scatter plot of epigenetic age measurements using our newly developed EpiAge next-generation sequencing assay for 41 study participants, using the linear regression model developed for EpiAgePublic in samples that had four technical replicates. Each point on the x-axis corresponds to the average EpiAge calculated for a blood sample (buffy coat) of an individual participant. The y-axis indicates the epigenetic age calculated for each replicate. Error bars represent the 95% confidence intervals for the mean epigenetic age of each individual. (C) Comparison analysis between EpiAgePublic (red dots) and EpiAge calculated using the HKG epiTherapeutics proprietary model (blue dots) relative to chronological age (Axe X). Correlation analysis was performed using Pearson’s R. The table provides a comparison of the correlation coefficient (r), 95% confidence interval, and R-squared values. (D) Epigenetic Age Acceleration (EAA) Comparison between control and AD patients calculated using EpiAge next-generation sequencing assay. This scatter plot compares the EAA between control participants (n=26) and Alzheimer’s Disease (AD) patients (n=28). Each dot represents an individual, and the plot shows the mean with SEM. The epigenetic age was calculated using the HKG epiTherapeutics proprietary model. Differences in EAA between the groups were analyzed using a two-tailed parametric t-test to assess statistical significance. (E) The left panel displays the Pearson correlation between Epigenetic Age Acceleration (EAA) and Mini-Mental State Examination MMSE in 7 male Alzheimer’s patients, while the right panel displays the correlation in 21 female Alzheimer’s patients. The middle line in each plot represents the linear regression fit, while the two lines surrounding it represent the 95% confidence bands, which indicate the variability of the correlation. (F) Comparative Analysis of Epigenetic Age Acceleration Across Alzheimer’s Disease, Mild Cognitive Impairment, and Control Groups Using Multiple Epigenetic Clocks. This figure presents the comparison of Epigenetic Age Acceleration (EAA) using multiple clocks: EpiAge, DNAmAge, DNAmAgeHannum, DNAmPhenoAge, DNAmAgeSkinBloodClock, DNAGrimAge v1, and DNAGrimAge v2. The data were derived from 96 control individuals, 111 with mild cognitive impairment (MCI), and 93 with Alzheimer’s Disease from dataset GSE144858, using DNA from human blood. The plot shows means with Standard Error of the Mean (SEM). For statistical analysis, we employed an ordinary one-way ANOVA to compare AD (Alzheimer’s) to controls and MCI to controls. Parametric ANOVA was used due to the normal distribution of the data. ‘Ns’ stands for not significant; * for p < 0.05; **’ for p < 0.01; *** for p < 0.001; and **** for p < 0.0001. Image: © 2025 Cheishvili et al.

