
One of the challenges of microscopy camera systems is that they don’t produce the same color rendering as the human eye. Technology exists to deliver true color microscopy images to laboratorians.
By Lauren Alvarenga
Many researchers and lab workers require microscopy images to show the exact color they see through their eyepieces. For instance, pathologists use colors to identify tissue types, while cytologists identify cell type based on color difference with a Papanicolaou stain.
So, how do you reproduce human eye color perception in your microscope images? To do so, you must first consider how your own eyes perceive color compared to microscope cameras and monitors.
The Color Rendering Anatomy of the Human Eye
A human eye has two types of cells: rod cells and cone cells. Rod cells are more sensitive than cone cells, allowing us to detect dim light and see at night. Humans have about 20 times as many rod cells than cone cells, perhaps because our ancestors spent time awake in the dark. But these cells cannot distinguish colors, so our eyes have trouble detecting colors at night.
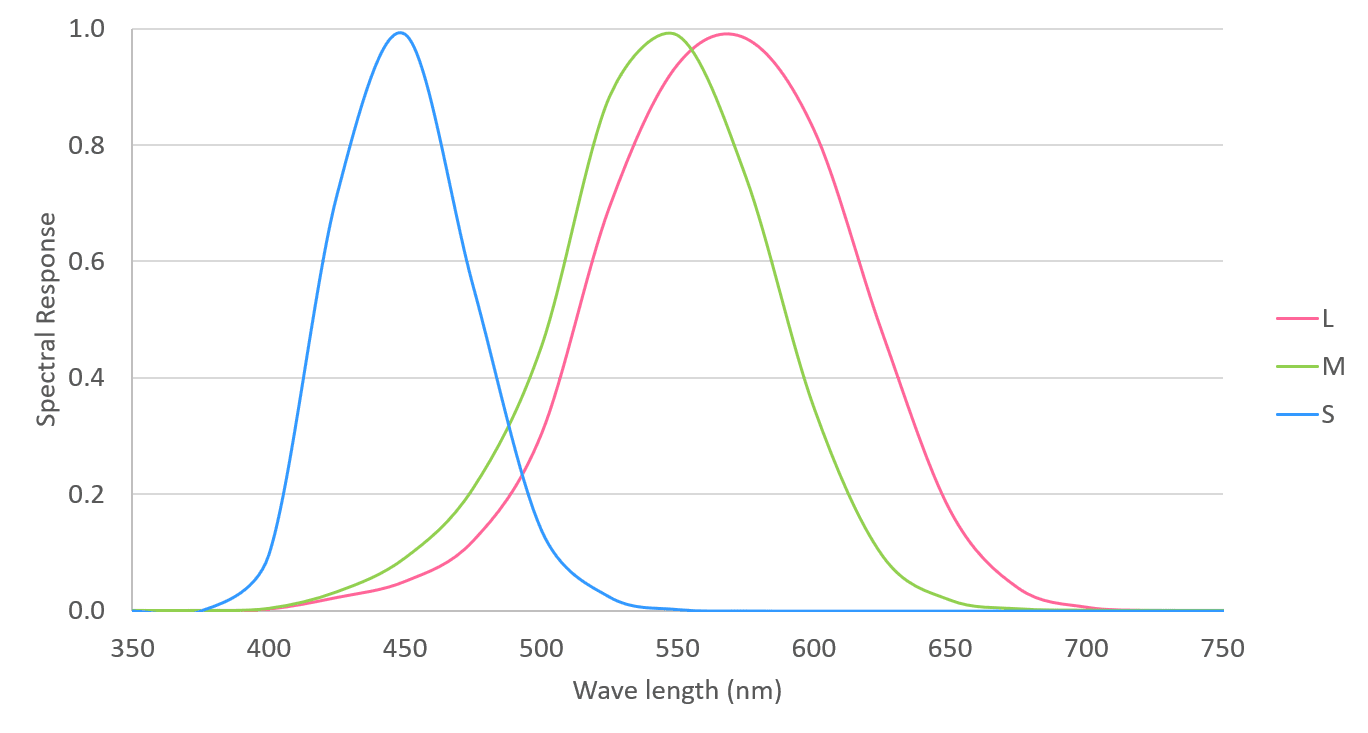
Cone cells, on the other hand, cannot detect dim light but can identify colors. To do so, they use three types of cells:
- L cone for longer wavelength light sensing
- M cone for middle wavelength light sensing
- S cone for shorter wavelength sensing
Evolution of Eyesight
Our ancient ancestors originally had four types of cones: ultraviolet (UV), blue, green, and red light. Today, fishes and birds still can see with this wide wavelength range. But after our ancestors lost cones for UV and green, we received the M cone as a mutation of the L cone for green light detection.
This better color resolution might have helped our ancestors gather food in the daylight. Our evolutionary history has led to our current spectrum response, shown in the table below. As you can see, M cones and L cones are close together, because the M cone evolved from the L cone.
How Microscope Cameras Detect Color
Camera sensors, such as a charge-coupled device (CCD) or complementary metal-oxide semiconductor (CMOS) sensor with a Bayer filter, feature a different spectrum sensitivity than the human eye. In addition, since a PC monitor’s light spectrum is based on an RGB signal, it cannot produce the same spectrum as the physical sample. This leads to differences between the image that is displayed from a microscope camera and what the user actually sees through the microscope.
Most camera sensors have a sensitivity over 700 nm, which causes images to look reddish from the infrared (IR) light. Since human eyes cannot see near IR or IR light, Evident digital microscope color cameras use an IR cut filter. Then we apply a microscopy dedicated image processing technique to convert signals from the sensor to the image data, which can be displayed on a monitor to mimic the response from your cone cells for accurate color rendering.
This is easier said than done because you must understand the microscope’s illumination spectrum, as well as the spectrum character of the specimen, dyes, colors, camera, and PC monitor.
But with our microscope data and knowledge of samples used commonly for biology, we developed microscopy color reproduction techniques for our microscope components and cameras to deliver the most realistic image.
We understand that color is one of the main methods to differentiate the relevant aspects of a sample, so it is vital that your digital microscope camera can accurately reproduce natural or stained colors as they appear through the eyepiece.
More Than White Balance: High Color Rendering LED
Halogen lamp illumination has for many years been the gold standard in microscope illumination. Thanks to the halogen lamp’s particular properties, excellent color rendering—both through the oculars and on the computer screen—can be obtained. However, LED technology has become a viable alternative for conventional lighting in many areas of everyday life. Its bright, efficient light output provides many benefits across industries.
An LED light source for microscopy should emit white light and match or even surpass the capability of halogen lamp light to show the colors of the sample correctly. This brings up an important question: how do you compare the color performance of an LED to halogen? Different light sources each have a unique illumination spectrum. While it is obvious that differences in spectra will alter how sample colors are represented, a precise and quantifiable comparison of light sources reveals the true impact of this variation.
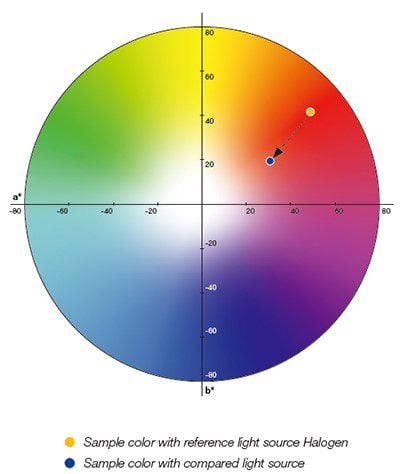
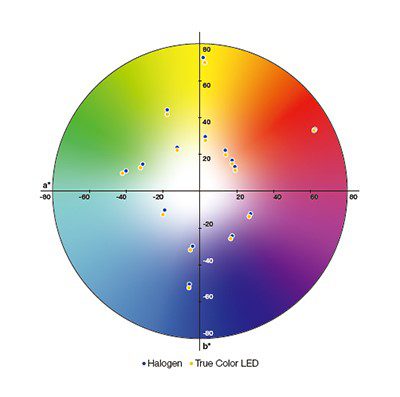
One way to make this comparison in a standardized, reproducible manner is to represent the rendered colors on a chromaticity diagram. With a chromaticity diagram, such as the a*b* chart in Figure 2, it is easy to visually compare the color rendering capabilities of two different light sources. Spectral differences between light sources will result in the same reference colors appearing at different locations in the diagram.
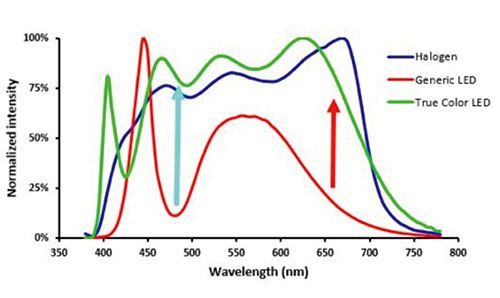
To date, many LED designs lack the light quality required to reliably distinguish colors in a specimen. The reason behind this becomes clear when comparing the emission spectra of the two light sources.
Compared to the halogen lamp spectrum, generic LEDs show more variability—especially at 480 nm and in the region between 600–700 nm. These wavelengths correspond to histologically important colors. Having an uneven relative intensity is a generic problem induced by LED illumination, and this variability has a clear effect on the color rendering ability of an LED light source.
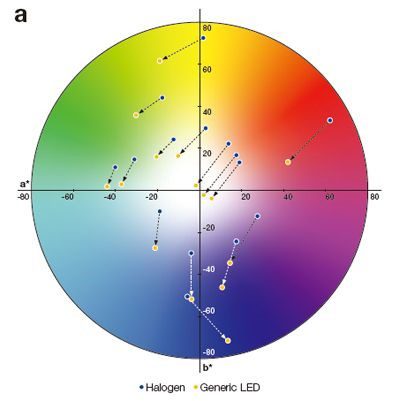
The effect of such a significantly different illumination spectrum can be clearly seen in a chromaticity diagram. Figure 3a indicates the color shifts when changing illumination from a halogen lamp to a generic LED light source. The overall effect of the different low-intensity regions in the spectrum is a lack of intensity at the red end of the spectrum and therefore a blue shift in the colors produced.
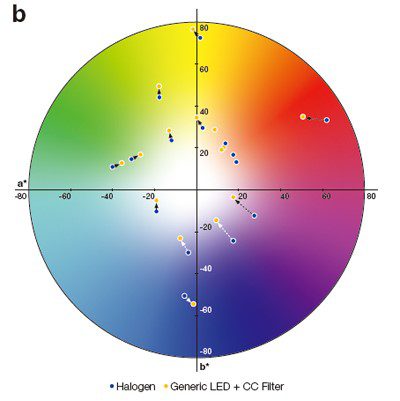
One way to compensate for this unwanted effect is to use a color correction (CC) filter or to white balance your image. CC filters can absorb some of the light at wavelengths where the intensity is too high, creating a more balanced spectrum. The effect is shown in Figure 3b. The colors with a CC filter are closer to halogen lamp illumination (shown by the shorter arrows), but there is still a considerable difference when compared with halogen lamp illumination.
The practical effect of the color shift caused by a generic LED light source, both with and without a CC filter, is clearly visible when imaging a stained tissue section using the different light sources. Figure 4 shows a tissue section illuminated by the three different light sources mentioned earlier.


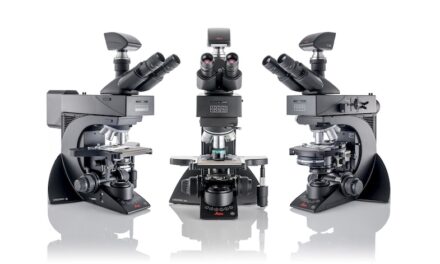
An example of the possibilities afforded by more biologically accurate color rendering system is the Olympus DP23 and DP28 digital microscope cameras from Evident. These cameras use a smart color management system to provide accurate color rendering. Integrated ICC color profiles preserve subtle color variations to show samples in their natural colors so that dyes look the way you expect them to.
To combine the benefits of LED—durable, bright, and uniform illumination—with accurate color rendering, Evident developed the True Color LED light source, which improves the color rendering ability of LED-equipped microscopes. Its spectrum (Figure 5) has a much more uniform intensity and shows particular improvement in the cyan and red regions (arrows). The spectral improvements also mean that it closely matches halogen lamp illumination (blue line).
Better Color Rendering with LED
The improved, more uniform spectrum has a considerable impact on the quality of light, and this can be verified once again using a chromaticity diagram. Figure 6 shows that there are no significant differences between the color reproduction of a halogen lamp and a True Color LED light source.
Comparing Microscopy Light Sources
How does the color rendering technology of True Color LED perform on real-world samples? To test this, the performance of our system was visually evaluated through a direct comparison against other commercially available LED light sources on common histological stains: hematoxylin and eosin (H&E) and Azan trichrome (Figure 7).
The color rendering ability of the True Color LED not only closely mimics the halogen lamp light source but also stays constant regardless of the light intensity. This enables the operator to adjust the illumination without any distortions to the colors in a specimen.


Figure 7 Comparing LED light sources. In both H&E-stained (a–d) and in Azan-stained tissue sections (e–h), True Color LED illumination shows no discernable color shifts compared to halogen lamp. Other commercially available LED sources show distinctive yellow shifts (c and g) or blue shifts (d and h). Photos: Courtesy of the author
LED illumination holds great potential due to its uniform intensity, high brightness, low energy consumption, and long lifetime. However, many LED sources lack the same spectral uniformity as halogen lamp illumination and cause color shifts. Evident’s True Color LED technology combines the benefits of LED technology with the capability to correctly show the sample colors, providing pathologists and clinical researchers with confidence when evaluating a stained sample.
About the Author
Lauren Alvarenga is a senior product manager for clinical microscopy at Evident Scientific. After receiving her Bachelor of Science degree in biomedical photographic communications from the Rochester Institute of Technology, she spent 5 years working in an academic core facility before moving into industry. She currently specializes in objective lenses, cameras, and imaging software.

