Akoya Biosciences Inc. announced that its Phenoptics solution contributed to the successful development of a novel platform, AstroPath, enabling researchers at Johns Hopkins University (JHU) to discover and validate a biomarker signature to predict immunotherapy response in advanced melanoma cases. The groundbreaking work, which is part of the ongoing collaboration between Akoya and JHU, and could have potential applications in other tumor types, was published June 11 in Science.
Immunotherapies utilize the immune system to combat cancer and are revolutionizing the treatment landscape, but they are effective only in a subset of patients. Biomarkers have the potential to identify those individuals who are most likely to benefit from treatment and improve the effectiveness of immunotherapy; however, there is a paucity of accurate biomarkers that can effectively predict long-term outcomes. In melanoma, this gap is particularly acute because there are no FDA-approved predictive tests for determining whether anti-PD-1 checkpoint inhibitors, a type of cancer immunotherapy, will be effective in a patient or not. A multi-institutional study of immuno-oncology biomarker modalities, published in JAMA Oncology in 2019, demonstrated that spatial biomarkers outperformed other biomarker testing approaches— such as gene expression profiling, tumor mutational burden (TMB) assessment, and PD-L1 immunohistochemistry (IHC) — for predicting response to immunotherapy treatment.
Researchers at The Mark Foundation Center for Advanced Genomics and Imaging at JHU and The Bloomberg-Kimmel Institute for Cancer Immunotherapy combined the Phenoptics multiplex immunofluorescence (mIF) platform with sky-mapping algorithms derived from astronomy to create AstroPath for deep whole slide imaging and spatially mapping microscopic sections of tumors. The lead investigators Janis Taube, MD, MSc, a pathology expert, and Alexander Szalay, PhD, an astrophysicist and data science expert, are, respectively, Director of the Division of Dermopathology, and the Bloomberg Distinguished Professor in the Department of Computer Science at JHU.
“Akoya’s Phenoptics solution, one of the underlying technologies of AstroPath, enables researchers to study how tumor and immune cells are spatially organized in a tissue sample and gives deep insights on how they interact to influence cancer progression and treatment response,” said Sneha Berry, PhD, a co-author of the paper, who is now a lead clinical research scientist at Akoya.
Study Results
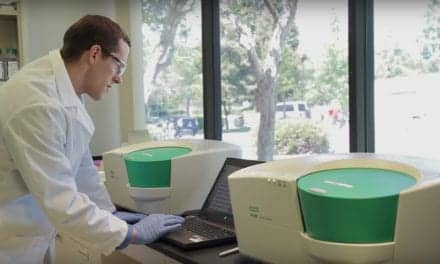
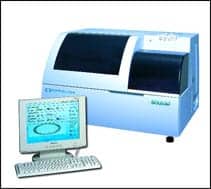
Through this study, the researchers identified a composite spatial phenotypic signature that is highly predictive of response to anti-PD-1 agents and of long-term outcomes for metastatic melanoma, and potentially other cancers. The researchers leveraged Akoya’s Opal chemistry and the Vectra mIF system (collectively part of the Phenoptics solution) to image six protein markers, PD-1, PD-L1, CD8, CD163, FOXP3, and SOX10, across the tumor microenvironment and spatially map different cell phenotypes. The team took a combinatorial approach to identify key determinants of therapy response, including specific cell phenotypes such as CD8+FoxP3+PD-1(low/mid expression) T-cells, which are correlated to positive response, and CD163+PD-L1negative myeloid phenotype, which is associated with non-response. The combination of these features resulted in a highly predictive composite biomarker with an area under the curve (AUC)* of 0.91, the authors concluded. AUC reflects the biomarker assay’s potential to be a future diagnostic tool. A perfect predictive test would have an AUC of 1.0 and the closer the AUC value is to 1.0, the higher the predictive accuracy. The team also validated the results in an independent cohort of samples, from another institution, resulting in an AUC value of 0.88. The biomarker signature also demonstrated the ability to predict overall survival in both the training and independent cohorts.
In the Science paper, the authors also laid out an integrated, multi-step process for biomarker development from discovery to translation, which they hope can be the framework for standardizing the application of mIF and image handling across institutions, thus enabling clinical implementation in the future. The depth of validation in the study, for example, verifying the results in an independent cohort of samples, serves as a template for cancer researchers to discover novel spatial biomarkers with high predictive potential.
Solving the Big Data Challenge
The analysis engine for AstroPath is the Sloan Digital Sky Survey, a 3D digital map of the universe built by Szalay. The survey’s telescope shares some similarities with the Phenoptics platform because they both capture multicolor images of objects; in the case of the former it is celestial objects and in the case of the latter it is different cell types in a tumor sample. In the field of astronomy, the survey database can be rapidly queried at a massive scale to spatially map and analyze stars and galaxies across the universe. Each tumor sample imaged with the Phenoptics platform generates a map of millions of cells with billions of different data points, posing a data analysis challenge. This challenge is compounded for translational studies that require researchers to study large cohorts of samples to discover new biomarkers. Taube and Szalay joined forces to solve this challenge by applying celestial object mapping algorithms to the study of the tumor microenvironment, enabling rapid probabilistic studies of how tumor and immune cells organize and interact to influence treatment response.
“We’re honored to have supported the JHU team in such a seminal study,” said Akoya Biosciences CEO Brian McKelligon. “We believe the unique approach to spatial biomarker discovery, applied through AstroPath, will have a tremendous impact on the scientific community and takes us one step closer to realizing a future with precision immunotherapy.”
Featured Image: The zoomed in area allows a deeper analysis of specified ‘hotspots’. Different colors represent different cell types and biomarkers e.g., PD-1, PD-L1 (checkpoint targets in pink and red respectively), cytotoxic T cells (a type of immune cell, in yellow), regulatory T cells (in orange), macrophages (another type of immune cell, in green), and tumor cells (in cyan). The cellular composition and distribution reveals immune engagement with the tumor, evidenced by the immune cells (in yellow, green and orange) infiltrating the tumor areas (in cyan). Photo: Akoya Biosciences


