Introduction
The use of fluorescence in clinical microscopy has become routine in fields such as microbiology and immunology, as well as in pathology testing labs. Clinical applications encompass a variety of antibody, viral, and genetic screening procedures (Table 1 below). These include direct and indirect labeling of antibodies and proteins,1 and staining of cells in mycological specimens.2-4 Typically, a fluorescent molecule, called a fluorophore or fluorochrome, is conjugated to a certain target of interest in the specimen. Many commercial kits and assays are readily available for preparing patient samples for clinical microscopy analysis.
Recently, more advanced methods are emerging from the research world and receiving increasing clinical acceptance, such as Fluorescence In Situ Hybridization (FISH), a technique that enables clinical-scale genetic screening based on molecular diagnostics. FISH uses highly specific DNA probes to detect genetic markers with fluorescent molecules (direct method) or nonfluorescent molecules that are tagged by fluorescent antibodies (indirect method).5 The probe DNA are labeled by specific fluorescence emission color and hybridized to DNA in either interphase or metaphase chromosomes after denaturing, so that the probe nucleotide sequences seek and bind to specific regions on target chromosomes. Direct visualization of the relative positions of the probes, and therefore, translocated genetic sequences, is possible using a fluorescence microscope equipped with color-contrasting fluorescence optical filter sets for each given fluorophore probe.
All of these examples use a fluorescence microscope that is equipped with an intense light source (usually a mercury arc lamp) and one or more sets of optical filters. Optical filters are essential for observing the labeled or stained specimens. Each fluorophore requires a dedicated set of filters optimized for imaging the particular color associated with the fluorophore. In addition to providing the best visual or optical performance for accurate identification and ergonomy, important factors that must be considered for optical filters in clinical microscopy are durability and cost. More durable optical filters do not “burn out” as a result of the intense illumination source, thus avoiding the need for replacement and downtime, and they may be cleaned like other optical components in a microscope to maintain high performance year after year. Furthermore, while the highest-performance filters might cost only a small fraction of a sophisticated research microscope (such as one with automation and digital imaging), the cost of such components can become prohibitive when outfitting a lab with a typical clinical microscope that has little or no automation and is viewed primarily by eye. In many cases, a clinical microscope is purchased with money from a hospital budget, rather than from a government-research or capital-equipment grant. Hence, it is critical to achieve the best possible performance with the microscope optics, including filters, optimized for reasonable cost. The long-term durability of the optics also leads to a lower total cost of ownership over time. Fortunately, due to recent advances in optical filter technology,6 filters that are affordable, durable, and exhibit excellent optical performance (such as the Semrock Brightline ClinicalTM filter series) now make advanced clinical observation possible.
|
|||||||||||||||||||||||||
| Table 1. Some examples of fluorescence used in clinical applications. |
Optical Filters and Fluorescence Microscopes
 |
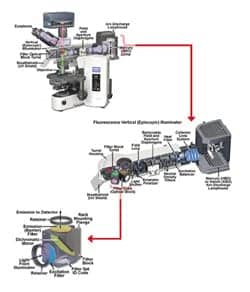
| Figure 1. Olympus BX-51 upright microscope showing detail of the Epi-fluorescence illuminator attachment, fluorescence filter cube placement in the turret housing, and optical fluorescence filters and their arrangement within a cube. Images courtesy of Mike Davidson (Molecular Expressions and Olympus America). |
Figure 1 shows a fluorescence microscope with an expanded view of the epi-fluorescence illuminator attachment where fluorescence filter cubes holding the optical filters are installed within a removable filter housing turret. Further detail of the fluorescence filter cube shows the configuration and placement of the three optical filters (excitation filter, dichroic beam splitter, and emission or barrier filter). It should be noted that modern fluoresence microscopes allow for easy installation or interchange of filter cubes by the user.
The optical filters are key components enabling the detection of fluorescence light from the sample, thereby enabling the functionality that lies at the heart of a fluorescence microscope. The critical role of fluorescence optical filters is often not appreciated, yet their proper use and specification is crucial to realizing optimal performance of a particular clinical fluorescence test or assay.
The operation of a fluorescence microscope using optical filters is schematically shown in Figure 2. The excitation filter passes a portion of light from the intense light source, which is then reflected by the dichroic beam splitter (also referred to as a mirror) such that it passes through the microscope objective and fully illuminates the specimen on the sample slide that is on the microscope stage. Some of the excitation light is absorbed by the fluorophore in the specimen, which then instantaneously emits longer-wavelength fluorescence-emission light. A substantial portion of the fluorescence emission is captured by the microscope objective, and then it is transmitted through the dichroic beam splitter and through the emission filter to the microscope eyepieces. In this so-called epi-fluorescence configuration, the set of three optical filters function together as a complete set to capture fluorescence-emission light and block contaminating excitation light and other potential sources of background light that would otherwise reduce sensitivity or even suppress the fluorescence from the fluorophore. This separation of the excitation and fluorescence-emission light paths both physically and spectrally is essential, since the fluorescence emission is very faint—it is typically four or more orders of magnitude weaker than the excitation light (< 1/10,000th).
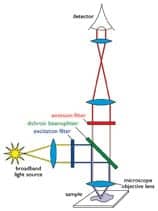 |
| Figure 2. Schematic of optical fluorescence filter functionality. |
Fluorescence Filter Functionality and Specification
An understanding of the crucial role optical filters play in fluorescence microscopes requires an understanding of the fluorescence absorption and emission process.7 A fluorophore absorbs incoming excitation light at wavelengths within its absorption-spectrum profile. It then re-emits longer-wavelength fluorescence-emission light at wavelengths given by its emission-spectrum profile.
A simple example that illustrates the specification of optical filters for fluorescein isothiocyanate ( FITC) is shown in Figure 3. The optical filter spectral profiles are shown superimposed on the FITC absorption and emission spectral profiles. The parameters that describe the placement of excitation and emission filters are the center wavelengths (CW) and bandwidths (BW). Here for simplicity, BW refers to the full-width-at-half-maximum transmission bandwidth, but bandwidth may also be specified as the minimum spectral width over which high transmission is guaranteed. For the example in the diagram, the excitation filter has CW = 475 nm with BW = 33 nm. A bandpass emission filter in this case (CW = 529 nm and BW = 33 nm) is designed so that it specifically captures fluorescence emission primarily from a single fluorophore (such as green emission).
 |
| Figure 3. Absorption and emission profiles for FITC fluorophore shown with transmission of Brightline Clinical FITC filters. The long pass emitter set is shown at left, and the bandpass emitter set is shown at right. Note how center wavelength, bandwidth, and edge wavelength are specified. |
Successful observation of fluorescence emission requires the excitation and emission filters to transmit as much light as possible at wavelengths within their respective bands. It is worth noting that while the spectra of bandpass excitation and emission filters appear symmetric when the transmission is plotted on a linear scale, suggesting that an excitation filter may be used as an emission filter, or vice versa, so long as the CW and BW are appropriate, in fact the blocking (visible only on a logarithmic scale) is typically not symmetric. Excitation filters are optimized to maximize blocking in the emission-filter transmission passband, and emission filters are optimized to maximize blocking in the corresponding excitation filter passband (that is, no overlap). The function of the excitation and emission filters is therefore complimentary, ensuring that excitation or other stray light does not spectrally leak, contaminate, and suppress the fluorescence-emission light. The CWs of the filters should be spectrally positioned so that overlap with the absorption and emission spectral profiles maximizes brightness.6 Widening the BWs of the filters also increases brightness.
Another important consideration for clinical samples is that a large amount of nonspecific fluorescence (resulting from the fluorophore of interest not bound to the desired target species) and autofluorescence (from all other fluorescing substances) may be generated from endogenous tissues, fluids, and other organic matter, resulting in a high background light level that can obscure the fluorescent tagged specimen and thus limit contrast. Nonspecific fluorescence and autofluorescence can be minimized by careful sample preparation8 but not totally eliminated.
Narrowing the bandwidths of the optical filters (particularly the excitation filter) can further reduce the background and enhance contrast (at the expense of brightness), since the observed autofluorescence background roughly increases in proportion to the bandwidth.6 A balance, therefore, has to be struck between the level of brightness versus background based on the desired observation criteria for a given application. Finally, it should be noted that optical filters need to be properly oriented with respect to excitation light to ensure that autofluorescence generation is minimal.
Dichroic beam splitters and long pass excitation filters are usually specified by a cut-on edge wavelength (EW) above which the filter transmits light. A long pass emission filter may transmit fluorescence from all fluorophores that emit light at wavelengths longer than the edge wavelength (such as green and orange emission). This property enables the clinical observer to see possible counterstains or other fluorescence emission that can be used to enhance contrast between different cells and parts of a biological cell.
Durability of Optical Fluorescence Filters
 |
| Figure 4. Transmission versus wavelength comparison between “burned-out” soft-coated, and Semrock UV excitation filters for DAPI fluorophore. Semrock filters have been exposed to more than 1,000 hours of continuous high intensity HG arc-lamp illumination. |
For clinical applications, durability of all aspects of the microscope, including the filters, is critical. Optical filters must be impervious to intense light sources that generate ultraviolet (UV) light that could lead to “burnout” (also known as photodarkening or solarization), particularly of the exciter filter as it is subjected to the full intensity of the illumination source.
Most filters used in clinical microscopy use older “soft-coating” technology that may carry explicit warnings for “exposed coatings” not to be handled or otherwise touched to prevent damage; in some cases, the coatings can even be wiped right off the substrate glass if not handled carefully. Absorptive or “colored” substrate glasses are also used in some exciter filters (particularly those optimized for Calcofluor White, DAPI, and other UV-excited fluorophores), and these filters are particularly prone to “burnout” since they contain impurities that lead to photodarkening. This can lead to a disastrous loss of transmission that may render the filter useless until the filter is replaced.
Modern filters such as the Brightline Clinical filter series do not suffer from catastrophic photodarkening or “burn-out,” nor spectral shifting or any other possible variations with usage. These filters are based on a thin-film manufacturing process called Ion-Beam Sputtered (IBS), which enables filters with “hard” oxide thin-film coatings to be constructed using a single, low-impurity glass substrate—the result is the highest possible transmission with exceptional durability and reliability. Such durability is ensured by regular testing and stringent compliance to the latest optical MIL and ISO standards.9 A typical example of filter “burnout” is shown in Figure 4, where “soft-coated” UV excitation filters that exhibit severe degradation in transmission (down to 10% to 15%) are shown in comparison to modern, “hard-coated” filters that have experienced more than 1,000 hours of continuous, high-intensity illumination from a mercury-arc excitation lamp.
Considerations for Fluorescence Observation
It has been discussed that there are many potential fluorescence applications in clinical microscopy and even within a particular application, there can be major differences in the types of specimens and samples. A clinical microscopist may be faced with large ranges in brightness and contrast due to variations in the concentration of fluorescently tagged specimens, as well as background, in clinically prepared slide sample slides. Despite this wide variation, however, most visual observations tend to fall within two broad categories governed by basic imaging properties.
Case 1. Maximize Contrast and Brightness
This case applies to sample slides that exhibit relatively little nonspecific fluorescence and autofluorescence and therefore tend to have a dark background away from the fluorescence target specimen. In this case, visual perception tends to favor the ratio of brightness to background (which can be thought of as contrast) more heavily than either attribute individually. Optimal observation is therefore obtained by maximizing both the contrast and the brightness. Optimal optical filter performance for this case is achieved by providing high transmission for the filter that directly impacts brightness, and also carefully selecting the CWs of the filters to maximize the fluorescence throughput (brightness) while simultaneously limiting the BWs of the filters to limit the amount of autofluorescence observed.
Achieving all of these considerations simultaneously is not trivial, but the benefits are clear and evident. Mike Nasello, supervisor, Clinical Microbiology Laboratories, Strong Hospital, Rochester, NY, states, “Having high brightness while maintaining good contrast allows identification of fluorescent tagged specimens not just in high titer (concentration) dilution samples but also for difficult to diagnose low titer cases.”
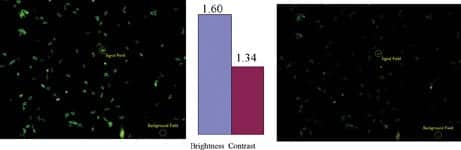 |
| Figure 5. Comparative brightness and contrast between “hard-coated” Brightline Clinical FITC-LP01 (left) and “soft-coated” (right) optical filter sets on Toxoplasma Gondii specimens tagged with FITC. Brightness (signal) and contrast fields used in comparison are indicated. |
Example images of a FITC-tagged sample are shown in Figure 5. Here an image photographed using a Brightline Clinical FITC-LP01 filter set is compared to one taken using a commonly used soft-coated filter set.
Case 2. Minimize Background and Maximize Brightness
This case applies to sample slides that exhibit very high background due to autofluorescence. Of particular relevance are samples containing fluorophores that require UV or blue excitation since shorter-wavelength light generates greater autofluorescence.10 With a very high autofluorescence background, visual observation does not perceive good contrast no matter the brightness. The tasks of minimizing the absolute value of background while retaining high brightness are mutually exclusive. The optimal filter set is obtained by choosing as narrow and specific an exciter filter as possible for the fluorophore while maximizing the transmission of all the filters (excitation, beam splitter, and emission or barrier) using advanced filter manufacturing techniques in order to generate good brightness.
In this case, Susan Romansky, Clinical Specialist, Microbiology Laboratory, Rochester General Hospital, Rochester, NY, explains that, “A darker background provides a crisper image from which minute yet critical features such as cell walls, septa, and hyphae in mycobacterial samples can be distinguished.”
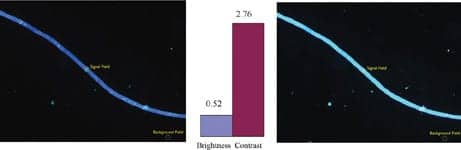 |
| Figure 6. Comparative brightness and contrast between Brightline Clinical CFW-LP01 (left) and wide band UV-exciter (right) optical filter set on fungal yeast cells stained with Calcofluor White. Signal (brightness) and background fields used in the comparison are indicated. All images captured using a 40x Olympus BX-41 microscope and Pixelink 1776 camera with 500 millisecond exposure. |
In Figure 6, an example is shown of fungal yeast cells stained with Calcofluor White viewed using the Brightline Clinical CFW-LP01 set and a commonly used optical filter set containing a wide-band UV exciter and long-pass emitter. The competitor image shows a diffuse background or fluorescence halo that extends over the entire observational field due to auto- and nonspecific fluorescence that washes out detail despite the fact that the specimen yeast cell appears quite bright. The markedly better contrast of the Brightline Clinical CFW-LP01 filter set allows clear visualization of the septa in the fungal yeast cells due to the narrow excitation filter (CW = 387 nm, BW = 14 nm) that generates much less autofluorescence while still providing high optical transmission.
Note that camera noise has been subtracted from both brightness and background fields in Figures 5 and 6 in the numerical comparisons to most accurately reflect what would be observed visually.
Summary
For clinical fluorescence microscopy, it is crucial that optical filters be chosen to give the best performance for a given application and fluorophore. The wide prevalence and variation of clinical fluorescence samples, as well as the increasing number of observations required of clinical microscopists, puts a premium on performance. Good performance involves selecting and optimizing spectral features of the filters (CW, BW, or EW) to maximize a combination of brightness and contrast. Such performance is critical when scanning fluorescent specimens for features at lower magnifications that may be difficult to discern before subsequent inspection at higher magnifications can provide a confirming diagnosis.
Equally important is the consideration of choosing durable coatings—particularly exciter filters that do not “burn out” and permit reliable observations and measurements time after time. Given the availability of modern optical filters such as the Semrock Brightline Clinical series based on “hard” coated technology (IBS) at a competitive cost, clinical microscopists should consider replacing any current “soft-coated” optical filters with “hard-coated” ones. One can then be confident that robust, statistically significant observations can be performed without worrying about whether optical filters installed in the microscope will degrade. A critical example is the necessity of maintaining clinical patient slide samples over time and being able to confidently make comparisons between past, present, and future samples.
Atul Pradhan, PhD, is the principal engineer for Semrock Inc, Rochester, NY. He can be reached at .
@WebPlus: For more information search for “microscopy” at the top of the page.
References
- Lehman D. Rapid diagnostic testing in microbiology-clinical issues. Med Lab Obs. 2003;35(5).
- Darken M. Applications of fluorescence brightners in biological techniques. Science. 1961;133:1704-1705.
- Hageage G, Harrington B. Use of calcofluor white in clinical mycology. Lab Med. 1984;15:109-112.
- Monheit JE, Cowan DF, Moore DG. Rapid detection of fungi in tissues using calcofluor white and fluorescence microscopy. Arch Pathol Lab Med. 1984;108:616-618.
- Werner M, Wilkens L, Aubele M, Nolte M, Zitzelsberger H, Komminoth P. Interphase cytogenetics in pathology: Principles, methods, and applications of fluorescence in situ hybridization (FISH). Histochem Cell Biol. 1997;108(4):381-390.
- Erdogan T, Pradhan A, Mizrahi V.Optical filters impact fluorescence fidelity. Biophotonics International. 2003;10(10):38.
- Lichtman J, Conchello JA. Fluorescence microscopy. Nat Methods. 2005;2(12):910-919.
- Neumann M, Gabel D. Simple method for reduction of autofluorescence in fluorescence microscopy. J Histochem Cytochem. 2002;50(3):437-439.
- Filter reliability. Available at: www.semrock.com/Reliability.htm. Accessed December 28, 2006.
- Drezek R, Brookner C, Pavlova I, et al. Autofluorescence microscopy of fresh cervical-tissue sections reveals alterations in tissue biochemistry with dysplasia. Photochem Photobiol. 2001;73(6):636-641.
