
With the right programs in place, ensuring effective monitoring of QC testing can be significantly easier
By Irwin Z. Rothenberg, MBA, MT(ASCP)
In clinical laboratories, the role of quality control (QC) is to enable laboratory staff to detect, reduce, and correct deficiencies in a laboratory’s analytical processes prior to the release of patient results. The QC process enables laboratorians to measure the precision of their processes—essentially, how well the laboratory’s measurement systems reproduce the same result over time and under varying operating conditions. When properly performed, QC helps to ensure the quality of patient test results reported by the laboratory.
In practice, laboratorians perform QC by running specially calibrated QC materials through the specific instrument or system to be tested, and comparing the resulting measurements against the expected values for those QC materials. QC is usually performed at the beginning of each work shift, after an instrument is serviced, when reagent lots are changed, after calibration, and whenever patient results seem inappropriate.1
Such ‘internal QC’ or ‘intralaboratory QC’ is essential for detecting problems that arise during the routine operation of laboratory methods. These types of problems may be caused by the instability of the method, as exemplified by changes in performance compared to what was observed earlier. By performing internal QC on a regular schedule—usually on a daily basis—laboratories are able to verify that the performance of their instruments is continuously within the expected range of performance. In essence, internal QC compares laboratory performance to itself over time, assuming that the performance observed earlier represents a correct or accurate test result.
Assumptions about the performance of an instrument are typically validated during an instrument’s initial performance qualification testing, which is performed whenever a new instrument is put into service. Such testing ensures that all systems are operating properly, and that the initial QC results are in line with the instrument’s performance specifications. To validate instrument performance on a continuing basis, however, laboratories should participate in a program of ‘external QC’ assessment through the use of a peer-reporting system.
Peer-Reporting Programs
In a peer-reporting program, a group of laboratories use the same brand and model of instruments to analyze the same specimens—usually specially calibrated QC materials with the same lot numbers—and submit their results to a central facility. The system provider then characterizes the performance of this group of laboratories—the peer group—by calculating the means and standard deviations (SDs) of the group and its individual members, and examining the results to identify outliers. The program provider generates reports that compare the performance of an individual laboratory to its peer group.2
Peer-reporting programs used by clinical laboratories typically belong to one of two types: proficiency testing surveys and interlaboratory QC programs. Both types provide laboratories with a means of comparing their own performance against performance expectations established by reference to a peer group of laboratories.
Proficiency Testing Surveys
To operate a proficiency testing survey, an external proficiency testing agency sends each participating laboratory a set of ‘unknown’ liquid or lyophilized specimens to be tested. Each laboratory assays the specimens for each test under review, and the results are reported to the proficiency testing agency (see “CLIA-Approved Proficiency Testing Programs“).
The proficiency testing agency collects data from all of the participating laboratories and, using a variety of statistical models, determines what the consensus value of the unknown sample should be for each test. The test results reported by each laboratory are then compared to the consensus values, and the laboratory is graded for accuracy.
The proficiency testing agency provides a report that contains summary data from all of the participating laboratories, together with an accuracy grading report. Among other data, the report identifies the standard deviation of all values submitted by participating laboratories for each test. This statistic can be used to compare and assess an individual laboratory’s day-to-day precision.
In the United States, proficiency testing surveys represent performance statistics collected from singular events that are conducted roughly three times each year. In other countries, proficiency testing surveys may be conducted somewhat more frequently.
Interlaboratory QC Programs
While proficiency testing surveys are based on statistics from events that take place only a few times each year, an interlaboratory QC program provides a statistical analysis based on performance data collected during repeated daily testing.
For an interlaboratory QC program, the service provider does not send calibrated external specimens to be tested. Instead, each month laboratories submit the test data they have collected for each set of internal QC materials they have tested.3 These data are combined with similar records from other laboratories that use the same instrument.
Both proficiency testing surveys and interlaboratory QC programs can help laboratories accomplish the following.
- Identify trends, instrument errors, or reagent issues as soon as they arise, ensuring validity and increasing confidence in the accuracy of results.
- Optimize error detection, minimize costly repeat tests, and reduce false rejections through the use of multirule QC procedures.
- Ensure confidence in assigned target values.
The general procedures for handling peer reporting for proficiency testing surveys and interlaboratory QC programs are the same (see “QC Data Peer-Reporting, by the Numbers“).3
Benefits of Peer-Reporting Programs
Laboratories that do not participate in peer-reporting programs can become, in effect, statistical islands, lacking any means by which to regularly verify the reliability of their work.
Individual laboratories can readily determine the precision of their methods by using data from their recent internal QC results to calculate the mean, SD, and coefficient of variation (CV) for each of their test methods. However, it is much more difficult to determine the accuracy of methods on an ongoing basis. Reliable estimates of performance are attainable only so long as there is enough data obtained over a long enough period of time.
The unique capability of peer-reporting programs is to monitor the accuracy of a laboratory’s test methods and make sure that they remain stable and on-target with the true or correct values. The essential characteristic of peer-reporting programs that make use of interlaboratory QC is the availability of results derived from the use of comparable instruments and test methods in other laboratories.
Although participating in a peer-reporting program adds steps to a laboratory’s QC processes, the benefits of having peer-reporting programs in place far outweigh any additional work that might be involved.3 Participating in a peer-reporting program that enables a lab to compare its processes to those of comparable labs offers a range of benefits, but also has some limitations.3 Key benefits include the following:
- A very good estimate of the bias, repeatability, and reproducibility of a laboratory’s analytical processes compared to those of a peer group of laboratories.
- An easy method of detecting error trends, so that corrective actions can be performed in a timely manner.
- From the behavior of a process analyzed via a peer-reporting program, it may be possible to deduce how the process will behave during a future proficiency testing examination—presuming that the matrices of the QC materials and the proficiency testing samples are similar.
- Potential for reducing the proficiency testing of duplicate instruments performing the same processes, since the peer-reporting program is being used to monitor the long-term stability of all of the instruments.
- Effective documentation of a laboratory’s performance for specific processes, throughout the entire period of participation.
Limitations of participating in a peer-reporting program include the following:
- The organization that operates the peer-reporting program must ensure that it can offer large peer groups of comparable laboratories; otherwise, the results of the program’s comparisons will be relatively uncertain.
- The matrix of QC materials typically differs from those of real-world biological samples, reducing the potential of the peer-reporting program to compare laboratories’ performance when using different methods.
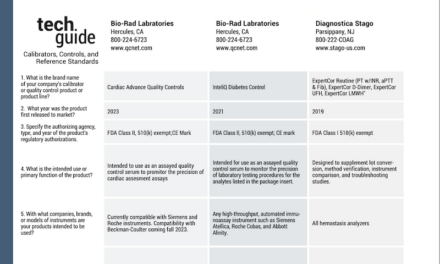
Many instrument manufacturers and quality control companies provide interlaboratory QC peer reporting programs for their clients (see “Interlaboratory Peer-Reporting Programs“).
The Laboratory Histogram

Figure 1. An interlaboratory QC histogram comparing the monthly and cumulative values for a participating laboratory against comparable values for the program’s peer group. The report is specific for laboratories using the same instrument and lot of QC materials for a particular immunoassay (in this case, for acetaminophen). Image courtesy Bio-Rad Laboratories.4
A typical histogram report from an interlaboratory QC program highlights the participating laboratory’s trending data over the past 12 months against the cumulative range of data for laboratories in the peer group, enabling the lab to see its own cumulative analytical data versus that of the peer group (see Figure 1). The histogram is an excellent tool for meeting regulatory and accreditation requirements that require laboratories to monitor bias and imprecision trends over time. Features of a histogram report include the following.
- Bar graph (a bar for each calendar month plus a cumulative bar) illustrating the participating laboratory’s mean performance versus the mean of the peer group as a whole.
- Data for each bar: mean, SD, CV, and number of data points represented.
- Labels and arrows clearly indicate values that fall outside of (above or below) the 2SD range.
- Displaying values less than or greater than 2SD, this report is useful for identifying both shifts and trends in monthly test results.
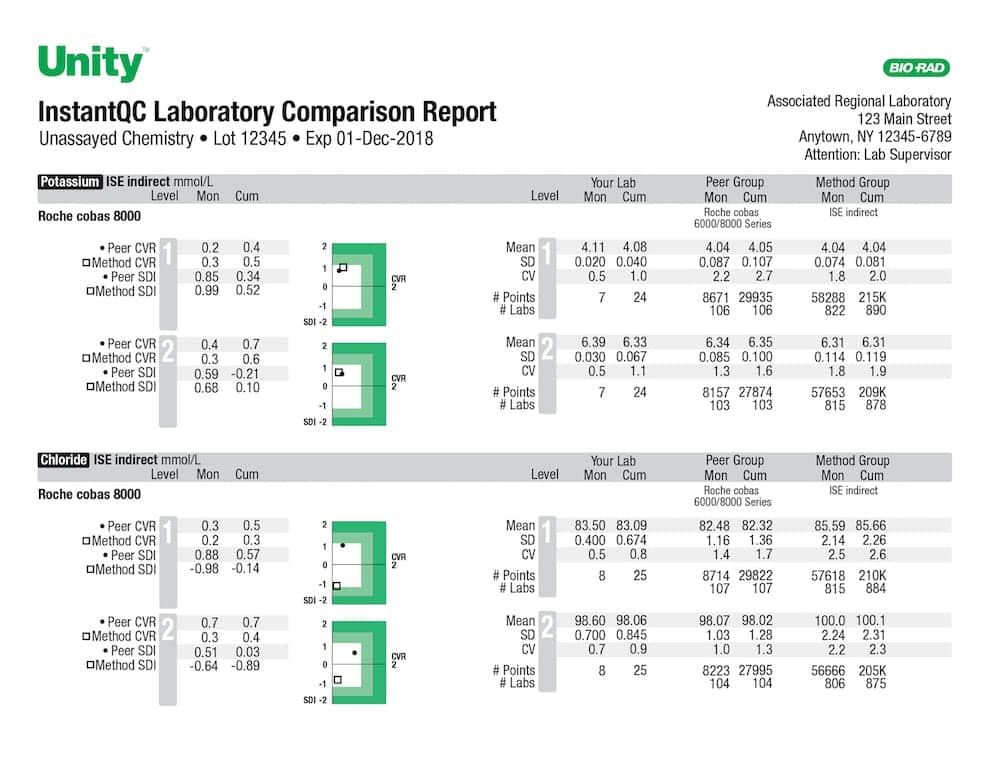
Figure 2. The Unity Interlaboratory Program by Bio-Rad Laboratories offers on-demand QC reports that are especially suited for troubleshooting system performance when a malfunction is suspected. Image courtesy Bio-Rad Laboratories.4
The Unity Interlaboratory Program from Bio-Rad Laboratories, Hercules, Calif, offers program participants the ability to receive QC reports on-demand (see Figure 2). Using up-to-the-minute peer-group performance data, such on-demand reports are particularly useful for troubleshooting performance when a malfunction of a laboratory’s test systems is suspected.
Conclusion
The value of peer-reporting programs has been known for decades, and has become even greater as such programs have gradually progressed from early forms of proficiency testing to today’s Internet-enabled interlaboratory QC programs. Such programs enable a laboratory to evaluate the effectiveness of its daily QC in a way that internal QC assessment by itself cannot achieve.
Peer-reporting programs help laboratories to identify trends, instrument errors, and reagent issues as soon as they arise, ensuring validity and increasing confidence in the accuracy of results. They also optimize error detection, minimize costly repeat tests, and reduce false rejections through the use of multirule QC procedures. Instrument and reagent manufacturers now offer a variety of interlaboratory QC programs for their user populations, providing excellent data for enhancing the quality of clinical laboratory testing.
Irwin Z. Rothenberg, MBA, MT(ASCP), is a technical writer and quality advisor for COLA Resources Inc, Columbia, Md. For further information contact CLP chief editor Steve Halasey via [email protected].
References
- Hayden, J. Three strategies for making QC management meaningful [online]. Clinical Laboratory News (September 1, 2015). Available at: www.aacc.org/publications/cln/articles/2015/september/three-strategies-for-making-qc-management-meaningful. Accessed August 23, 2017.
- Westgard J. Basic QC practices [online]. Madison, Wis: Westgard QC, 2009. Available at: www.westgard.com/qc-pt-eqa.htm. Accessed September 13, 2017.
- Kristensen HB. Proficiency testing versus QC-data-comparison programs [online]. Brønshøj, Denmark: Radiometer, 2003. Available at: https://acutecaretesting.org/en/articles/proficiency-testing-versus-qcdatacomparison-programs. Accessed August 23, 2017.
- Unity Interlaboratory Program [online]. Hercules, Calif: Bio-Rad Laboratories, 2015. Available at: www.qcnet.com/molecular/pdf/Q-1144.pdf. Accessed September 13, 2017.

