
Multiple instruments testing as the core of a quality control procedure provides a number of advantages and complexities for clinical laboratories.
By John Yundt-Pacheco and Nico Vandepoele
With the increase in volume of patient testing, clinical laboratories are increasing capacity through higher throughput instrumentation or bolting on capacity by adding new identical instruments. In order to simplify quality control (QC) management, some laboratories have turned to using a single mean and single standard deviation (SD) across multiple instruments, which have a number of advantages.
Designing QC procedures for multiple, identical instruments testing the same analyte is more challenging than designing QC for a single test method, because the bias between instruments introduces additional complexity and risk. While bias is a consideration for any laboratory, it is particularly a concern in the context of multiple instruments testing the same analyte within the laboratory. If the bias between the highest and the lowest instruments testing the same analyte becomes too great, it could interfere with the clinical interpretation of results from a patient specimen that was tested on those instruments sequentially.
There are two basic approaches used by laboratories: the traditional method of designing QC for each instrument individually with unique targets and SDs for each instrument or designing QC for a system of identical instruments with a common target and SD.
A recent study1 explored this approach by evaluating lab data to understand the impact on patient risk of harm from erroneous results when a single QC target is used for multi-instrument testing the same analyte instead of individual, instrument QC targets. The impact of using a single QC SD instead of individual, instrument QC SDs on the distribution of false rejections was also evaluated.
These assessments were made using the QC data from a laboratory with five identical instruments, running the same reagents and testing the same analytes. Two levels of QC were evaluated on eight analytes. The single QC target was the mean of the five instruments and the SD was selected so that the false rejection rate on a single instrument matches the false rejection rate of the aggregated instruments, for the same given multi-rule (1:3s,2:2s, R4s).
To compare the approaches, a relatively new metric was used, risk management index (RMI). The RMI compares predicted risk of patient harm to acceptable risk of patient harm. An RMI ≤ 1 indicates managed risk, an RMI >1 indicates unmanaged risk. An RMI of 0.5 indicates ½ the acceptable risk of harm, while an RMI of 2 indicates twice the acceptable risk of harm. 2,3
The RMI is computed as the ratio of predicted rate of erroneous results to the maximum acceptable rate of erroneous results. The predicted rate of erroneous results is estimated from the test method quality specification, performance, reliability, and QC strategy. The maximum acceptable rate of erroneous results is determined based on the institutions assigned severity of harm for each analyte.
Setting the QC Target
The impact of using QC targets based on the individual instrument means vs. a single QC target based on the mean of the instruments can be understood by considering a simple QC rule where control limits are computed as QC target ± k*QC SD’s (ex. k=2 for the classic 1:2s QC rule). If the same k and QC SDs are used, there is an equal amount of drift in the QC mean around the QC target in the upward and downward direction before a QC rejection takes place. When there are several instruments testing the same analyte, there are usually multiple biases between individual instrument means and the mean of all the instruments.
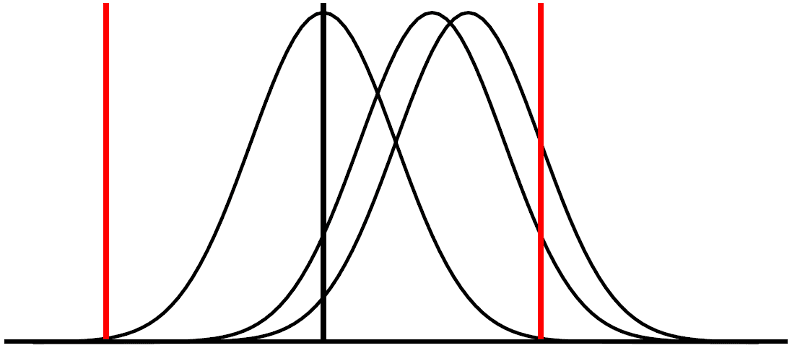
When the QC target is set to the individual instrument mean, of an instrument that is biased high compared to the mean of all the instruments, there will be the same amount of drift upward (increasing the bias) as there would be for drift downward (decreasing the bias), before a QC rejection. A similar situation exists for an instrument that is biased low compared to the mean of all the instruments; the same amount of drift upward (decreasing the bias) as there would be for drift downward (increasing the bias), before a QC rejection. See Figure 1.
If a single QC target (the mean of all the instruments) is used for all the instruments, there will be less tolerance for drift in the same direction of a bias and more tolerance for a drift in the other direction which will reduce bias and improve test method performance. This results in a reduction of risk for the worst-case scenario. See Figure 2.
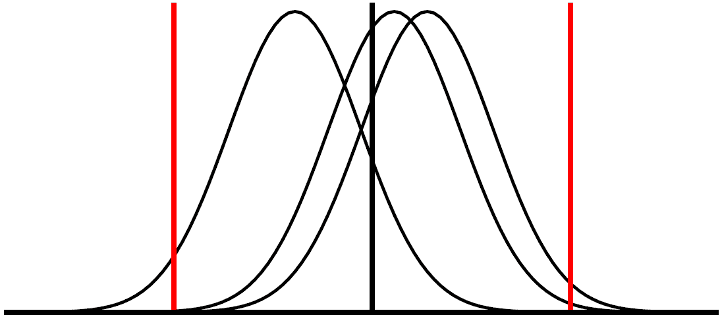
Using a single QC target for managing testing for several units the same analyte reduces the risk of patient harm from erroneous results since the maximum risk will always be less than using individual instrument means for QC targets. The worst-case scenario for a single QC target is better than the worst-case scenario for using individual instrument means.
In the aforementioned study, the maximum RMIs were computed for each of the QC strategies studied. In each case, the greatest risk was found when using individual instrument means for QC targets. Using a single QC target reduced risk in the worst case.
Setting the QC Standard Deviation for Multiple Instruments Testing
All QC procedures have a false rejection rate, that is the rate of QC rejections when the test method is not out-of-control. False rejections are problematic for the laboratory as they waste time and resources troubleshooting a non-existent problem. False rejection rates generally involve a trade-off with the power of error detection for a QC procedure: the higher the power of error detection, the higher the false rejection rate. QC procedures are usually designed around the required power of error detection which implies an associated false rejection rate. However, when there are multiple instruments testing the same analyte, there are opportunities to change the distribution of the false rejections among the different pieces of equipment.
Using a single QC SD for managing multi-instrument testing the same analyte will partition the average false rejection rate so that the devices with the worst imprecision will have the highest false rejection rate. The better performing instruments will have a lower false rejection rate. This will focus attention on the worst performing units. If individual instrument SDs are used for the QC SDs, all of the units will have the same false rejection rate, meaning that the best performing instrument will have the same number of false rejections as the worst performing instrument. This is inefficient as the time spent pursuing false rejections on the best performing instruments would be better spent checking the performance of the problem instruments. As the single QC SD has been selected so the false rejection rate of the collection of instruments matches the false rejection rate of using individual instrument QC SDs, there is no difference in the collective false rejection rates, just a change in the distribution of the false rejections.
Multiple Instruments Testing: Combining a Single QC Target and a Single QC SD
A single QC target and a single QC SD can be combined in a QC design for multi-instrument testing the same analyte. When instruments have similar performance, the single QC SD can be selected to have a matching false rejection rate while maintaining the risk advantages of using a single QC target. If there is a significant difference in instrument performance among the instruments this may not be possible as the single QC SD required to match the false rejection rate of an instrument SD QC design may need to be too large to maintain the risk advantage. In the mentioned study, designs using a single QC target and SD were found that had a risk advantage in six of the eight analytes, in one case the risk in both approaches was too low to compute and in one case there was equal risk.
When a single QC target and a single QC SD cannot be used because the SD required would be too large, the population of instruments should be evaluated. There will usually be an outlier instrument that has a significantly higher bias or worse precision. If possible, steps should be taken to improve the performance of the outlier instrument such that its performance returns to similar performance as the group. If this is not possible, it’s QC design will need to be managed outside of the group. Fortunately, this is fairly uncommon.
The Impact on Laboratory Management

Using a single QC target and SD across all instruments testing the same analyte reduces the work to manage the QC program as there will be fewer QC targets and SDs to manage. In this case presented, five identical devices there was an 80% reduction of QC items (QC means and SDs) to maintain when using the single QC target and SD compared to using individual instrument QC target and SDs.
More importantly, in addition to having few QC items to maintain this practice will reduce the risk of patient harm from erroneous results in the worst case when compared to using individual instrument means, and redistribute false rejections from the best performing units to the worst performers.
The complexity of having testing multiple units the same analyte requires greater attention to QC design than the simple case of only having a single instrument testing an analyte because of the additional risk of patient harm from erroneous results introduced from the bias between units. Using single QC target/SD will help mitigate the risk and make managing your QC program easier.
References
1. Yundt-Pacheco JC, Vandepoele N, Hansen C, Ruth B, Grenache D. Designing Multi-Instrument QC Procedures to Reduce the Risk of Patient Harm from Erroneous Results Poster, 2022 AACC Annual Meeting, Chicago
2. Yundt-Pacheco JC, Parvin CA. Computing a risk management index: correlating a quality control strategy to patient risk. Clin
Chem. 2017;63:s227-s228.
3. Parvin, C. A., & Baumann, N. A. (2018). Assessing Quality Control Strategies for HbA1c Measurements From a Patient Risk Perspective. Journal of Diabetes Science and Technology, 12(4), 786–791.
About the Authors
John Yundt-Pacheco, MSCS, is a scientific fellow who performs research in quality control and patient risk issues in the Informatics Discovery Group at Bio-Rad. He has had the opportunity to work with laboratories around the world, developing practical real-time, inter-laboratory quality control and proficiency testing systems.
Nico Vandepoele, BSc, serves as scientific and professional affairs manager for Bio-Rad Laboratories Quality Systems Division. He works to promote an understanding of laboratory regulations and best practices as they pertain to QC and EQA/PT programs.


