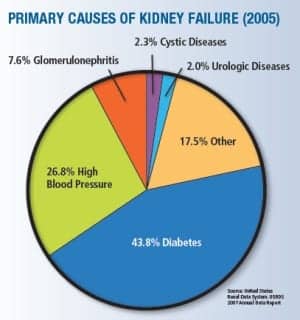

Source: United States Renal Data System. USRDS 2007 Annual Data Report
One in every 10 health care dollars is spent on diabetes and its complications, and one in every three Medicare dollars is spent on treating kidney disease, primarily on renal patients as a result of diabetes,”1-2 says Douglas Borses, director, sales and marketing, Diazyme Laboratories, Poway, Calif. “So there’s a tremendous push from both patient advocacy groups and Congress3 for earlier identification of diabetes and kidney disease so that early treatment can take place.”
One big area of concern is the dramatic rise in Type 2 diabetes. In recent years there has been a 40% increase in the prevalence of chronic kidney disease and a corresponding doubling of the incidence of end-stage renal disease and tripling of Americans on dialysis, much of which is driven by the diabetes epidemic in the United States. The epidemic appears to be getting worse, with a dramatic rise in Type 2 diabetes in all age groups and particularly among teens and tweens, largely attributable to the increase in obesity in these groups, Borses says.
Although there are now several new sensitive tools for early detection of kidney disease and monitoring diabetes, these biomarkers are for the most part only being utilized by specialists. The vast majority of primary care physicians have not yet adopted these emerging biomarkers in clinical practice. “Old methodologies die hard; if you have been around the lab for a while you may have witnessed the slow death of CPK-MB and Acid Phos, among others,” Borses says. “However, the need for more sensitive tools for early detection is critical if we are to address these public health issues. We saw similar physician resistance in the 1980s to patient self-glucose monitoring for diabetes.”
WHAT’S BEHIND THE REPORTED INCREASE IN DIABETES AMONG TEENS AND TWEENS?
Although an increase in Type 2 diabetes among teens and tweens has been reported in recent publications, historically there has been little scientific literature on this subject, Borses notes. However, he says, a quick review of the literature revealed two papers discussing the increasing incidence of Type 1 diabetes mellitus in children younger than 15 in Europe3 and a second paper discussing the increasing incidence of Type 1 in Colorado youths 0 to to 17 years old.4 The first study noted an increase in 18 of the 20 registries followed, and the increase ranged from 0.6% to 9.3%, with an overall European increase of 3.9%. In this study, some of the higher increases occurred in the Nordic countries (Denmark, Norway, Finland, and Sweden), Eastern European countries (Czech Republic, Austria, Slovenia, Hungary, and Romania), and the UK.
“Some thoughts on why the incidence of Type 1 diabetes has increased include: modern lifestyle, environmental factors, increase in weight and height, C-section deliveries, and reduced frequency of infection. This study was done to predict new cases of Type 1 diabetes in the future in order to ensure that appropriate health care resources will be available to deal with this trend. The second study reviewed the incidence of Type 1 diabetes in the 0-to-17-year-old population from 1978 to 1988 (14.3%) to the incidence in 2002 to 2004 (23.9%), which is a 1.6-fold increase. The overall finding was that Type 1 diabetes increased 2.3% from 1978 to 2004, and that a change in population demographics may play a role in this increase. This group cited other studies in Philadelphia and Allegheny, Pa, where changes in population demographics led to an increase in the incidence of Type 1 diabetics. This group also had several hypotheses on what is causing this increase, which included: hygiene hypothesis (decrease in early- life infections, leading to impaired maturation of the immune system), correlation between asthma and Type 1 diabetes, accelerator or overload hypothesis (increasing BMI in genetically susceptible individuals accelerates B-cell decline at an early age, leading to Type 1 diabetes), and a more-permissive early life environment,” Borses says.
He notes that in the late 1970s, the conventional wisdom was to keep patients with diabetes “a little sweet”; physicians and patients believed that a trace of sugar in the urine was the best way to maintain optimal control of diabetes. A trace of sugar in the urine often represents a blood sugar level well above 200, a level that today would be considered out of control. At that time, however, such levels were not seen as dangerously high or putting patients at risk of long-term complication. Rather, a trace of sugar in the urine meant that the patient was well-controlled because there was little risk of insulin shock, causing hypoglycemia or diabetic coma due to too much glucose.
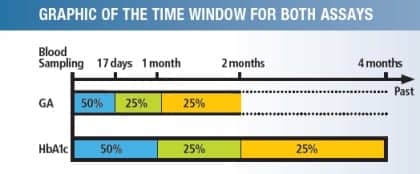
Measurement of glycated albumin can confirm changes in blood glucose status 1 to 2 weeks after the commencement of treatment. Blood glucose status can be more accurately assessed in a monthly interval with the measurement of glycated albumin than with the measurement of glycated hemoglobin.
Borses says that it took the massive Diabetes Control and Complications Trial (DCCT), a major clinical study conducted from 1983 to 1993 and funded by the National Institute of Diabetes and Digestive and Kidney Diseases, to prove that newer, more sensitive tools were needed to help people with diabetes maintain a blood glucose levels as close to the nondiabetic state as possible to slow the onset and progression of the eye, kidney, and nerve damage caused by diabetes. This study established the irrefutable effectiveness of tight control of blood sugar to reduce complications as well as HbA1c’s key role predicting the long-term complications of diabetes.
Diagnosis, however, remained bound to the problematic oral glucose tolerance test. The problems with the oral glucose tolerance test are due to the inherently biological day-to-day variability of fasting and 2-h postprandial glucose concentrations and a lack of rigorous harmonization of glucose vales. Since hemoglobin A1c has long been harmonized and the biological variation is less than glucose, the next logical step seemed to be moving to HbA1c for diagnosis. Professional organizations such as the American Diabetes Association and the College of American Pathologists (CAP) pressed for higher performance standards for HbA1c, in part so the assay could be used for diabetes screening, Borses says.
“With the higher analytical standards in place, the American Diabetes Association, among others, recommended adoption of HbA1c for screening for diabetes. The use of HbA1c for screening is not universally accepted,” he says.
Borses says the recently recognized problem is that not all patients will show the same HbA1c levels at a given glucose level, making interpreting and using HbA1c test results challenging for both physicians and patients. There are now newer technologies that can be used in conjunction with HbA1c to provide a better indication of the long-term risk of complications and of the effectiveness of the overall treatment plan and the risk of complications in all individuals with diabetes.
HERE ARE THE MAJOR PRO AND CON ARGUMENTS
HbA1c FOR SCREENING AND DIAGNOSIS: Pro Position
- Both OGTT and FPG require ≥ 8-hour fasting followed by repeat testing on another day (compliance poor)
- OGTT requires diet of ≥ 100-150 g carbohydrates for 3 days prior
- HbA1c requires no fasting, simple blood draw, good intraindividual reproducibility
- OGTT has high intrasubject variability due to recent exercise, stress, length of fast
- HbA1c reflects long-term glucose levels
HbA1c FOR SCREENING AND DIAGNOSIS: Con Position
- Not appropriate for patients with accelerated RBC turnover and anemia
- HbA1c levels appear higher for African Americans and certain other ethnic groups1
- Hemoglobin variants may interfere with some assays
- No outcomes studies with prediabetics
- Many countries lack lab infrastructure, making HbA1c testing impossible
- American College of Endocrinology and WHO feel endorsement is premature
Source: Diabetic Medicine 2009, vol 26:128-133,
Diabetes Care 2008, vol 31:1991-1996
A new shorter-term marker of blood sugar control, enzymatic glycated albumin, has been used quite successfully with HbA1c to monitor patients with diabetes, he says. Earlier studies attempted to use fructosamine as a marker of glycated serum protein to assess diabetes control, but the old fructosamine method did not correlate well to long-term complications as well as HbA1c.
“The problems with the old fructosamine assay are well understood,” Borses says. “The NBT fructosamine test, which is the most common in use today, is based on the reducing activity of glycated proteins. However, studies have shown that only about half of the reducing activity [fructosamine] was due to the specific glycation of proteins in healthy subjects and well-controlled diabetics. The remaining unspecific activity varied from serum to serum. It was independent of the glycation of albumin, which normally accounts for about 80% of glycated serum proteins.
“HbA1c is a very specific analyte; we can trace it directly to the level of glucose in the blood,” Borses says. “With the newer enzymatic methods for glycated serum protein [(GSP)/Glycated Albumin (GA)], such as Diazyme’s Glycogap, we can also directly correlate the result to the sugar in the blood with a level of specificity. Additionally, GSP/GA provides a snapshot of the patient’s control over the preceding 2 to 3 weeks, which is helpful for a more rapid evaluation of effectiveness of diet, activity, or medication adjustments than HbA1c, which gives a snapshot of the preceding 2 to 3 months.” There are also specific advantages to using GSP/GA where HbA1c is of limited value, he adds. GSP/GA is especially useful for monitoring patients on hemodialysis or peritoneal dialysis, as well as patients with gestational diabetes, hemolytic anemia, or blood loss.
Race affects results for both HbA1c and GSP/GA. Studies have shown that people of color glycate more than other people, so either method alone is less useful in some patients than other patients, Borses notes.
“GSP can be very useful here as well,” he says. “The difference between the actual measured HbA1c concentration and the predicted HbA1c from glycated serum protein is called the glycation gap. The glycation gap information provided by measuring HbA1c and glycated serum protein [GSP] together offers improved diagnostic accuracy by more reliably predicting complications of diabetes, including nephropathy and retinopathy, than HbA1c or GSP alone.
“The single most powerful indicator of long-term complications of diabetes is the gap between glycated albumin and HbA1c, more powerful than either is alone,” Borses says. One way to address this, Borses says, is to use both indices together. Regardless of the individual, studies show the glycation gap information to be quite universal.
In short, Borses says, “Using glycated albumin together with HbA1c, we can make the next positive step in providing better care for all people with diabetes.”
REFERENCES (PART 1)
- United States Renal Data Systems. (www.usrds.org)
- National Kidney Disease Education Program. (www.nkdep.nih.gov)
- 112th Congress Kidney Legislation S. 2163: Kidney Disease Equitable Access, Prevention, and Research Act of 20124. Sacks DB. A1C versus glucose testing: A Comparison. Diabetes Care. 2011;34:518-523.
PART 2: Use of HbA1c Expands from Diabetes Monitoring to Diagnostic Role
by Gary Tufel
Offering alternative testing options to health care providers
David J. Ledden, senior key expert, POC Immunoassay, Siemens Healthcare Diagnostics, Tarrytown, NY, says HbA1c has played a major role in monitoring chronic hyperglycemia in diabetic patients. “The consensus recommendation of the International Expert Committee in 2009—that HbA1c testing is the preferred method for the diagnosis of Type 2 diabetes in nonpregnant adults—has started a new and important chapter in the role of this important biomarker. In their most recent clinical recommendations in 2010, the American Diabetes Association indicated that HbA1c is an alternative diagnostic tool to blood glucose, thereby leaving the decision on what test to perform in the hands of the health care provider,” he says, and notes an excellent review by Bonora et al titled “The Pros and Cons of Diagnosing Diabetes with A1c.”5 The utility of HbA1c as a diagnostic marker for Type 2 diabetes is in its infancy, much like its monitoring claim in 1982, Ledden says.
BACKGROUND
“This year we celebrate the 30-year anniversary of the DCCT (Diabetes Control and Complications Trial),” Ledden says. A major outcome of this study was that for the first time physicians had a biomarker for chronic hyperglycemia (preceding 2 to 3 months) that correlated with the complications of diabetes mellitus (eg, retinopathy, nephropathy, and cardiovascular disease). This biomarker was hemoglobin A1c (HbA1c), which allowed physicians to monitor the glycemic state of their diabetic patients. This information was used to counsel and establish treatment plans (eg, diet, exercise, oral hypoglycemic, and insulin therapy) designed to bring HbA1c levels under 9%.
Today, Ledden says, physicians have several tests to assess glycemic control in their diabetic patients in different situations (eg, acute, intermediate, and chronic hyperglycemia). Acute testing (a point in time) can be fasting plasma glucose (FPG) or 2-h oral glucose tolerance test (OGTT) plasma glucose. Intermediate tests (2-to-3-week time frame) for glycemic control include fructosamine (FA) and glycated serum albumin (GSA). HbA1c is the standard method (8 to 12 weeks) for assessing chronic hyperglycemia. It should be noted that the acute and intermediate tests are extracellular measures, whereas HbA1c is the measurement of nonenzymatic glycation of hemoglobin within the red blood cells, Ledden says.
HbA1c is and continues to be the clinical standard for monitoring chronic hyperglycemia and correlates with the complications of diabetes mellitus. Like all diagnostic tests, it is not perfect, Ledden says, and over the last 30 years researchers have identified situations where the HbA1c value may not represent the true glycemic state of a diabetic patient. Patients with hemoglobinopathies, factors that impact erythrocyte survival or age (eg, malaria, uremia, chronic anemia, major blood loss, hemolysis, and pregnancy) hyperbilirubinemia, iron deficiency, and diabetics on peritoneal or hemodialysis may give the wrong information concerning glycemic control. For example, diabetic patients on hemodialysis give the appearance of being in good glycemic control when measured by HbA1c, when in reality they were in poor glycemic control when measured by FPG and GSA. In a similar fashion, HbA1c underestimates glycemic control in diabetic patients with anemia. In late pregnancy (third trimester), HbA1c levels increase in diabetic women, giving an indication that they are in poor glycemic control. However, when tested using GSA they were shown to be in good glycemic control.
Ledden says that Sacks1 published an excellent paper comparing HbA1c and glucose testing. For any blood test there are three factors that contribute to variation in results: 1) biological (ie, intraindividual and interindividual differences), 2) preanalytical (ie, issues that occur prior to analysis) and 3) analytical (ie, the measurement procedure).
The intraindividual variation of glucose ranges from 5.7% to 8.3%, whereas interindividual variation can be as high as 12.5%. It is the preanalytical variation that adversely affects glucose testing (eg, medications, prolonged fasting or exercise, stress, diurnal variation, source of blood, and sample handling can all impact glucose concentrations). Sample handling can be a big problem in that glucose values decrease 5% to 7%/hour due to glycolysis, even in the presence of inhibitors of glycolysis (eg, fluoride). The analytical variation of glucose testing, which is done enzymatically (ie, glucose oxidase or hexokinase), is solid exhibiting good precision and accuracy, Ledden says.
It is the biological variation of HbA1c that has the largest impact, he says. Intraindividual variation in nondiabetic patients is minimal, and interindividual is greater. There is evidence that HbA1c values are not constant among individuals having similar blood glucose and FA levels. This phenomenon is known as the glycosylation/glycation gap (GG) and appears to be related to interindividual differences in the glycation rate which is related to the intracellular concentration of glucose. Several factors can influence the GG: rate of glucose uptake in the RBC, rates of intracellular glucose metabolism, glycation rate, deglycation rate, and RBC life span. It appears that GG is an inheritable trait, but its clinical significance is unclear. Race and ethnicity also play a role in HbA1c variation as evidenced in a large study by Herman et al2 on Type 2 diabetics. In their study, the estimated mean plasma glucose did not differ between Caucasian and non-Caucasian groups. However, the HbA1c was higher in Hispanics (9.4 ± 1.4%), Asians (9.2 ± 1.4%) and other racial/ethnic groups (9.7 ± 1.5%) as compared with Caucasians (8.9 ± 1.2%). Again, it is not clear that these differences have any clinical significance. The preanalytical factors for HbA1c variation are a real positive as most of the factors that alter FPG have no impact (eg, fasting is not required, whole blood is stable for 1 week at 4°C and at least 1 year at -70°C). Factors that influence HbA1c preanalytical variation include: shortened RBC life span, acute blood lost, hypertriglyceridemia, hyperbilirubinemia, uremia, chronic alcoholism, chronic ingestion of salicylates, and anemia. The analytical variation in HbA1c is related to the detection technology. The three most common methods to measure HbA1c are: immunoassay, boronate chemistry, and cation-exchange high-performance liquid chromatography (HPLC). The NGSP and IFCC have developed reference methods in order to standardize the assay methods. It is hemoglobin variants that are responsible for analytical variation in some assays (eg, HbS, HbE, HbC, HbD, and HbF). When choosing an IVD instrument for HbA1c testing, it is important to understand the system ability to detect these hemoglobin variant to ensure accurate results, Ledden says.
“As mentioned above, physicians have several options to test for glycemic control (short-, mid-, and long term). Intermediate tests (2- to 3-week time frame) for glycemic control include fructosamine (FA) and glycated serum albumin (GSA). FA is an extracellular measure of total serum protein nonenzymatic glycosylation. To some extent, standardization and variation of the underlying serum protein turnover may make it incomplete, but it is an excellent tool for diabetics with end stage renal disease (ESRD) who are on hemodialysis. FA is unchanged by hemodialysis and indicates poor glycemic control whereas HbA1c values suggest these patients are in good control. GSA is also an intermediate glycemic control marker that is an extracellular measure of nonenzymatic glycosylation of human serum albumin (HSA). The enzymatic method for GSA involves hydrolysis of HSA into glycated amino acids, which are oxidized producing hydrogen peroxide in the presence of peroxidase and dye produce a colored reaction product which is measured spectrophotometrically. Total HSA is measured spectrophotometrically by dye binding (eg, bromocresol green or bromocresol purple). GSA has been shown to be a more effective indication of glycemic control than HbA1c in diabetic patients undergoing hemodialysis, neonates (circumvents HbF interference), gestational diabetes, unstable plasma glucose levels, anemia, hemoglobin variants, and diseases that shorten RBC life span. GSA may be the preferred method for monitoring glycemic control in normal pregnancy. These two midterm glycemic tests are by far the best way to monitor the effect of diet and exercise on glycemic control. In addition these markers offer a means to monitor and adjust therapeutic intervention in diabetic patients. In the future, GSA standardization and determination of a normal range will need to be dealt with before there will be widespread adoption of this assay,” Ledden says.
“As mentioned previously, HbA1c testing has primarily been used for monitoring of known diabetics. With the recommendations from multiple medical associations to now use HbA1c as a tool to diagnose diabetes and prediabetes, more work will need to be done regarding clinically relevant levels of precision along with reference ranges that are age, gender and ethnicity specific,” Ledden says.
Gary Tufel is a contributing writer for CLP.
REFERENCES (PART 2)
- Sacks DB. A1C versus glucose testing: A Comparison. Diabetes Care. 2011;34:518-523.
- Herman WH, Dungan KM, Wolffenbuttel BHR, et al. Racial and ethnic differences in mean plasma glucose, hemoglobin A1c and 1,5-Anhydroglucitol in over 2000 patients with type 2 diabetes. J Clin Endochrinol Metab. 2009;94(5):1689-1694.
- Patterson CC, Dahlquist GG, Gyuitus E, Green A, Soltesz GA, EUROLAB Study Group. Incidence trends for childhood type 1 diabetes in Europe during 1989-2003 and predicted new cases 2005-2020: a multicentre prospective registration study. Lancet. 2009;373:2027-2033.
- Vehik K, Hamman RF, Lezotte D, et al. Increasing incidence of type 1 diabetes in 0- to 17-year-old Colorado youth. Diabetes Care. 2007;30:503-509.
- Bonora E, Tuomilehto J. The pros and cons of diagnosing diabetes with A1C diabetes care. 2011;34:Supp 2 S184-S190.

