
Early operational data can show how referral networks, routine histopathology, ancillary testing, and turnaround time shape a new laboratory long before the service reaches maturity.
By David Adler, MD, PhD, MBA; Aaron Perner, LLM; Karoline Reidenbach; Sven Perner, MD, PhD
When a new pathology laboratory opens, some of its most important decisions have to be made before its future workload is fully visible. Staffing, histology capacity, immunohistochemistry workflows, reporting processes, referral relationships, and plans for advanced testing all have to be built while the service itself is still taking shape.
That was the situation we encountered during the first months of routine operations at a newly established pathology institute, PATHORA Institute of Pathology & Tissue Medicine, in Reutlingen, Germany. To understand how the service was developing, we reviewed all 2,114 consecutive cases accessioned between Feb 9 and July 27, 2026. Rather than looking at one disease or specimen type, we examined the early operation as a whole: case volume, referral patterns, specimen mix, malignant diagnostic coding, ancillary testing, and turnaround time.
The review showed that some patterns emerged quickly, while conventional administrative data underestimated other parts of the workload. Four lessons stood out.
1. More Referrers Did Not Mean a Different Case Mix
The referral base expanded rapidly. During the observation period, the cumulative number of referring physicians increased from 54 to 112. Yet the composition of the workload changed surprisingly little.
Urology remained the largest referral source throughout the period, accounting for 54.6% to 61.8% of cases each month. Oral and maxillofacial referrals remained in a similarly narrow range of 11.5% to 15.4%. The proportion of cases carrying a malignant diagnostic code also stayed relatively stable, between 17.9% and 24.7%, with an overall rate of 20.3%.
For us, the message was that growth in the referral base does not automatically create diversification. We did not formally map referral pathways, so we cannot determine why the mix remained stable. Operationally, however, adding new referring physicians did not materially change the case mix during this early period.
That’s important for planning. Early routine-operation data should not automatically be dismissed as an unrepresentative start-up phase. In some settings, the first months of evaluable routine operation may already reveal referral patterns that remain relatively stable as the service begins to grow. Laboratories seeking broader specialty representation may therefore need to develop new referral pathways deliberately rather than assume that diversity will emerge as the referral base expands.
2. A Precision-Oncology Strategy Still Rests on Routine Histopathology
The institute was developed with a strong precision-oncology orientation, but the early workload demonstrated how much a specialized diagnostic strategy still depends on conventional pathology.
Core needle biopsies represented 25.5% of the full case volume, cytology 16.3%, small excisions 11.6%, and oral and maxillofacial specimens 11.2%. Vasectomy specimens, resections, incisional biopsies, and other routine materials made up much of the remainder. Most cases did not carry a malignant diagnostic code.
That experience changed the way we think about capacity planning for a new specialized service. It is tempting to design infrastructure around the most advanced future capability—molecular diagnostics, predictive biomarkers, or other precision-oncology services. But those capabilities are layered onto a much larger operational foundation. Accessioning, tissue processing, routine histology, immunohistochemistry, cytology, and reporting capacity remain central from the beginning.
For laboratories launching a specialized program, the everyday specimen mix may therefore be just as important as the strategic vision. Advanced testing cannot be planned separately from the routine diagnostic workload that supports the service.
3. Billing Data Can Underestimate the Work the Laboratory Performs
A second operational blind spot emerged when we compared recorded immunohistochemistry with actual laboratory practice.
Immunohistochemistry was documented through billing codes in 14.9% of the 2,114 cases. But that number clearly understated the work being performed. In relevant prostate specimens, basal-cell immunohistochemical panels were routinely used during diagnostic work-up. Among 319 cases in this category, 224 (70.2%) had no immunohistochemistry billing entry during the early operating period.
The broader lesson is not specific to prostate pathology. Some laboratory activities are highly visible because a referring clinician explicitly requests them or because they generate a discrete billing entry. Other tests are selected by the pathologist as part of the diagnostic process. They can be clinically essential while remaining comparatively invisible in routine administrative extracts.
For laboratory leaders, that creates a risk. If workload assessments rely only on billing records or referral requests, they may underestimate the true consumption of reagents, technical time, professional interpretation, and bench capacity. Operational planning should therefore combine administrative data with information derived from the laboratory workflow itself.
4. Turnaround Time Is Meaningful Only in Context
We also manually reviewed a consecutive 500-case subcohort to obtain a more detailed view of diagnostic activity and reporting time. The median turnaround time from specimen receipt to report finalization was one day (IQR, 1-3 days; range, 0-14 days). Median turnaround was one day for core needle biopsies and cytology and four days for resections.
While a number like that is easy to present as an achievement, we think that would be the wrong interpretation.
During the opening months, the laboratory had no accumulated historical backlog, the case mix included many relatively routine specimens, and molecular testing remained outsourced. The operating model was still evolving. A short turnaround time in that context is best understood as a baseline characteristic of the early service—not as a permanent benchmark that should remain unchanged as diagnostic complexity grows.
As laboratories take on more complex cases, expand immunohistochemistry, bring molecular testing in-house, or increase consultation between pathologists, reporting time can lengthen even while the service itself becomes more capable. Turnaround time should therefore be interpreted together with specimen complexity, ancillary testing, workload, and the range of diagnostic services being delivered.
Early Routine Operations Can Become a Planning Tool
New laboratories are often described as being in a ramp-up phase, as though their early data are mainly noise that will become meaningful only later. Our experience suggests that once routine workflows and documentation are reliably evaluable, those early data can already be informative.
Within the first five and a half months of evaluable routine operations, several structural features of the service were already visible. Referral numbers continued to grow, but the case mix remained relatively stable. Routine histopathology formed the operational base on which more specialized diagnostics could develop. Administrative data captured only part of ancillary-testing activity. And turnaround time could not be interpreted sensibly without understanding the operating model behind it.
The first months do not, of course, fully predict what the mature laboratory will look like. A new service will continue to change as referral networks broaden, new testing moves in-house, and case complexity evolves. But early data can provide useful information about where demand is coming from, what resources are actually being consumed, and whether the service is developing in the direction intended.
For laboratory leaders opening a new facility or building a new diagnostic program inside an established organization, the lesson is straightforward: Measure the early operation closely. Those first months can provide valuable information about how the diagnostic service is taking shape.
Data source note: All numerical observations in this article derive from the authors’ internal retrospective review of aggregate routine operational data from PATHORA Institute of Pathology & Tissue Medicine covering Feb 9 through July 27, 2026. The analysis has not been previously published.
Institutional support: The operational review underlying this article was supported internally through PATHORA Institute of Pathology & Tissue Medicine’s routine institutional infrastructure and personnel. No external grant or third-party funding was received.
About the authors:
David Adler, MD, PhD, MBA, is chief scientific and medical officer at PATHORA Institute of Pathology & Tissue Medicine in Reutlingen, Germany.
Aaron Perner, LLM, is chief strategy and financial officer at PATHORA Institute of Pathology & Tissue Medicine in Reutlingen, Germany.
Karoline Reidenbach is a medical student affiliated with PATHORA Institute of Pathology & Tissue Medicine in Reutlingen, Germany, and contributed to the operational data analysis underlying this article.
Sven Perner, MD, PhD, is chief executive officer of PATHORA Institute of Pathology & Tissue Medicine in Reutlingen, Germany, and a specialist in pathology.
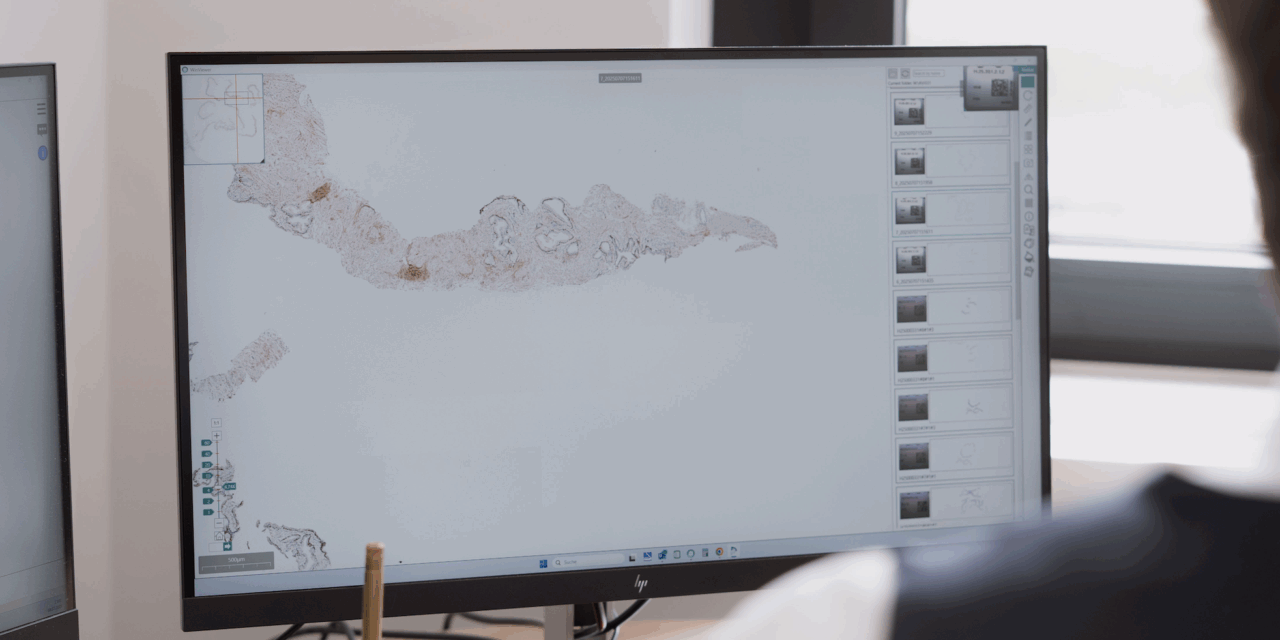
Photo caption: PATHORA Institute of Pathology & Tissue Medicine
Photo credit: Provided