
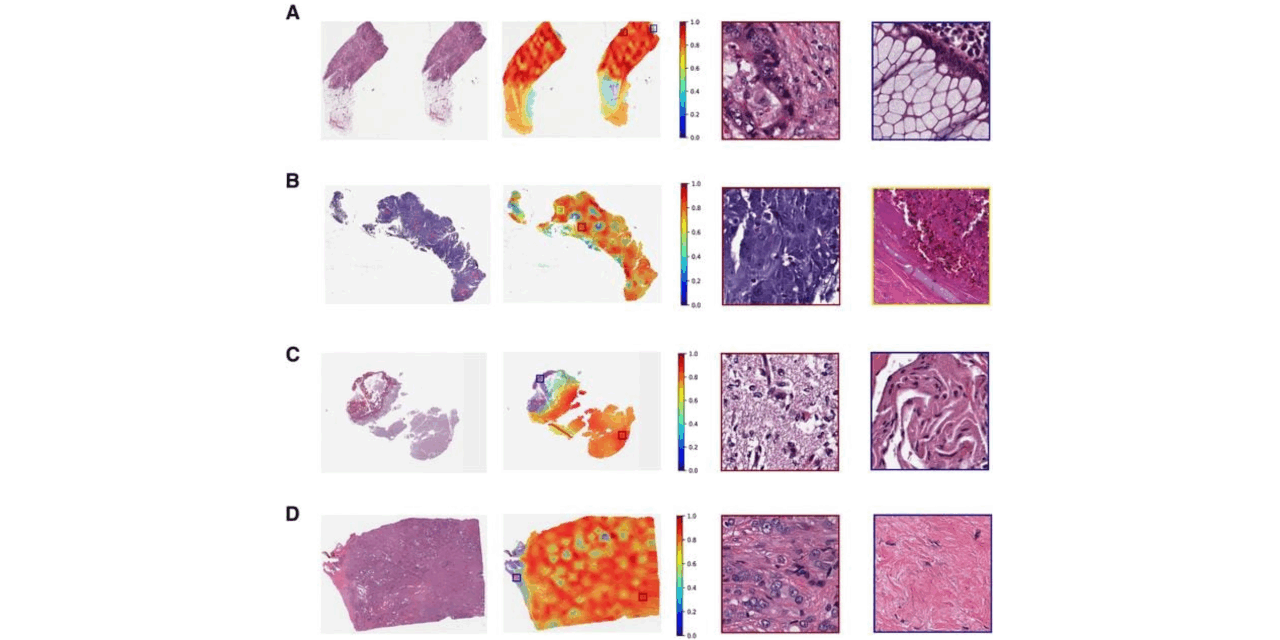
The Vision Transformer model analyzes routine whole slide images to identify TP53 mutations and survival outcomes.
Researchers developed an artificial intelligence (AI) model that analyzes routine histopathology images to simultaneously predict cancer subtypes, genetic mutations, and survival outcomes across 32 different solid cancers. The study, published in The American Journal of Pathology, highlights how computational pathology can connect routine diagnostic imaging with molecular oncology.
Histopathology remains the gold standard for cancer diagnosis, but clinical workflows currently depend on additional molecular and genomic assays to identify key alterations. These include mutations in TP53, which is one of the most frequently altered tumor suppressor genes. Because TP53 mutations influence tumor growth and treatment resistance, accurate molecular profiling is necessary for guiding treatment and improving patient outcomes.
“Standard molecular profiling for TP53 mutations is often costly and inaccessible in underprivileged or remote clinical settings,” says Alex W Hewitt, PhD, co-lead investigator at the Menzies Institute for Medical Research and School of Medicine, University of Tasmania, in a release. “We wanted to develop a more practical tool for pathologists. Currently, most deep learning-based models are used for single-model concepts; one model for one task. We developed a single model that can generate seven outputs simultaneously from the whole histopathology image, including TP53 mutation status, TP53 RNA expression, tumor type, and survival-related outcomes at the slide level.”
The Vision Transformer model analyzes routine hematoxylin and eosin stained whole slide images of human solid tumors. It was trained on a dataset of more than 11,000 primary tumor cases from the Pan-Cancer Atlas, which included somatic mutation, RNA-sequencing, and clinical outcome data.
In an independent validation set of 1,729 slides, the model achieved an area under the receiver operating characteristic score of 0.766 for TP53 mutation detection across 32 solid tumor types. The model also demonstrated the ability to infer TP53 RNA expression levels and tumor taxonomy directly from the images.
Because whole slide images are complex and obtaining expert annotations for every tumor region is difficult and subjective, researchers used a weakly supervised learning strategy. This allowed the model to learn from slide-level labels and identify patterns across image patches without requiring exhaustive pixel-level annotations.
“This approach could help identify patients who may benefit from confirmatory molecular testing, support triage in settings with limited genomic testing, and provide additional decision support to clinicians,” says Abadh K Chaurasia, PhD, co-lead investigator at the Menzies Institute for Medical Research, University of Tasmania, and Pandani Solutions Pty Ltd, in a release.
The researchers note that the method is intended to be complementary to molecular testing rather than a replacement. Its potential use is as a screening, prioritization or decision-support tool within diagnostic pathways.
“Accurate molecular profiling from routine histopathology slides, already widely used in cancer care, could transform clinical oncology,” says Hewitt in a release.
Photo caption: Input patches were extracted at 6× downsampling, corresponding to an approximate magnification of 6.7× relative to the original WSI resolution (approximately 40×). Slide-level attention across four WSIs was randomly taken from the independent set. Each row corresponds to one slide, showing the thumbnail, overlay attention, and the highest- and lowest-attention patches at 40× magnification, with boxes covering a large area of the tissue (the highest- and lowest-attention patches are at the center of the boxes’ tissues) to highlight the selected area of the WSIs so that the boxes are visible. The model predicted cancer type, TP53 mutation status, TP53 RNA expression levels, and clinical outcomes for overall survival (OS) and progression-free interval (PFI) events, measured in months. A: Cancer: rectum adenocarcinoma | TP53: 0 [expression (expr) 10.07] | OS: 1 (65.5 months) | PFI: 1 (44.8 months). B: Cancer: head and neck squamous cell carcinoma | TP53: 0 (expr 10.86) | OS: 0 (49.2 months) | PFI: 0 (29.7 months). C: Cancer: brain lower-grade glioma | TP53: 1 (expr 10.31) | OS: 0 (38.2 months) | PFI: 0 (33.0 months). D: Cancer: prostate adenocarcinoma | TP53: 0 (expr 10.03) | OS: 1 (48.5 months) | PFI: 1 (41.1 months).
Photo credit: The American Journal of Pathology / Chaurasia et al