
Implementing robust quality control procedures are critical in maintaining testing quality and accuracy over time.
By Jennifer MacCormack
Implementing quality control (QC) procedures that go beyond the basic regulatory requirements[i] can have an immediate positive effect on the quality of the results a laboratory delivers to providers and patients. Not only can best practices in laboratory quality control improve the quality of your test results, but they can also save the laboratory time and money.
Adjusting Quality Control Ranges for Better Control
The package inserts that come with assayed quality control material state the manufacturer’s expected mean and standard deviation for each level of control. A laboratory should always assess the data from daily QC runs to ensure that their own quality control results are consistently falling within this established range. This is generally the case, as manufacturer’s QC ranges are normally wide enough to be forgiving of some variability among laboratory settings. However, with some controls, the manufacturer’s acceptable ranges can be set so wide as to be ineffective at truly controlling the test.
Many instruments have excellent accuracy and precision and operate with a much smaller standard deviation (SD) and coefficient of variation (CV) than those listed in a control material’s package insert. That is, on a well-maintained system that is operating properly, the data points from QC runs will often remain quite close to the mean. Retaining a wider acceptable range means that problems may not be noticed until the system is very out of control, possibly affecting the reliability of patient results. This costs the laboratory time and money in several ways, including:
- Technologist time and laboratory resources used in troubleshooting
- Instrument downtime while problems are corrected
- Cost of lookback on patient results that may have been erroneous
- Repeat testing of patient specimens
Tightening the acceptable ranges over time based on the laboratory’s own data will make quality control runs more meaningful: With tighter acceptable limits, an out-of-range result is an early warning system for an instrument problem.
It is already standard practice in many laboratories to confirm the suitability of new lot numbers of a quality control while the old lot is still being used for daily QC. After collecting a few days of data from runs of the new lot, the laboratory can calculate a mean and SD and compare these to the manufacturer’s stated values in the package insert. This process is sufficient to assess whether the new lot of QC is acceptable for use, but this small amount of data is insufficient to establish new ranges for the laboratory.
In order to define stricter QC ranges for controls, the laboratory will need more data than is collected in an average lot-to-lot comparison. This will allow a historical CV to be defined, which can then be used to assess new lots. A laboratory can establish an historical CV by reviewing data from at least three months of daily quality control runs, preferably including multiple lots of quality control material. Using the historical data, the laboratory can calculate the mean, CV and SD for each analyte. Spreadsheet programs can perform these calculations using built-in equations. Many online tutorials can assist with performing the calculations manually[ii], if required.
In the example shown in the Levy-Jennings[iii] chart in Figure 1, a laboratory initially used the manufacturer’s mean and 2SD range for their normal WBC control. The package insert stated a mean of 7.3 K/µL and a 2SD range of ±1.2 K/µL.
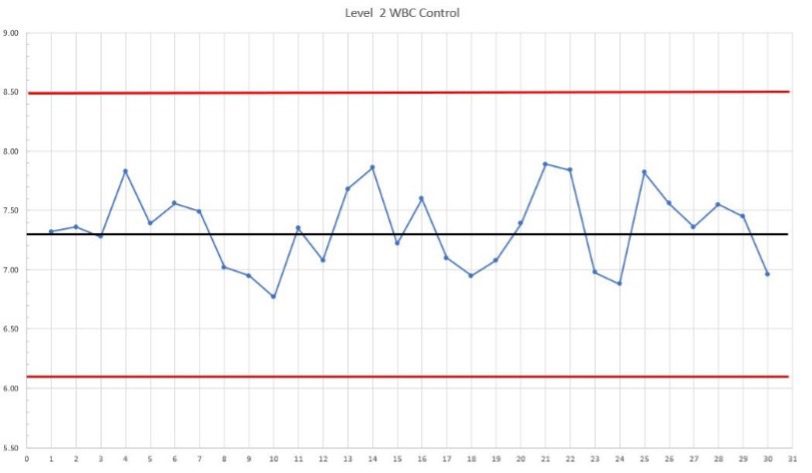
After collecting a month of data, it was clear that the laboratory’s instrument was operating well within these parameters, and the laboratory director asked the technical consultant to examine the data and determine whether they could implement more meaningful ranges.
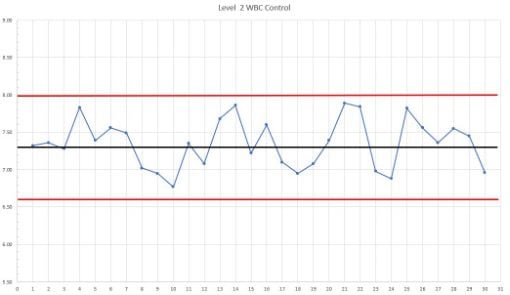
The laboratory’s data had a mean of 7.34 K/µL and a CV of 4.43%. This CV is representative of the laboratory’s real-world precision over time, and can be used to calculate a new SD and establish acceptable limits for the laboratory’s QC results. After reviewing the data, the laboratory director approved implementing the new 2SD range of ±0.7 K/uL for this control. The QC graph using the new ranges is shown in Figure 2. Using these tighter ranges for controls is appropriate because the instrument reliably performs within these parameters; results outside of these ranges indicate a change in the test system and should be investigated.
Importance of Big-Picture QC Review
While testing personnel must review each daily run to ensure results are in range prior to patient testing, weekly review of quality control results is highly recommended. Some accreditation organizations require documented review of QC every 7-10 days. The purpose of this weekly review is to see the bigger picture: shifts or trends in the data that indicate the quality of the test system is unstable or deteriorating. These reviews can detect problems before they are severe enough to result in failed QC, which means that they can be corrected before any patient results are in question.
Figure 3 shows a Levey-Jennings control chart of a laboratory’s level 2 triglyceride control results over several weeks. The target mean value is shown by a black line, and the 2SD range is marked by two red lines. Testing personnel who are only evaluating QC results one day at a time may not note a problem or implement any corrective actions until day 25, when the results begin to exceed the high end of the acceptable range. However, when the results are plotted daily and reviewed together, it is much easier to notice a drift upwards beginning around day 16 or 17. This could be due to deterioration of the control itself, but it may also indicate an instrument problem; if that is the case then patient results from that time period could also have been drifting slightly higher than they should have been. Depending on laboratory procedure, this may trigger a look back at patient results over that time period to determine whether any may need to be repeated. Intervening earlier, when the drift is just beginning, saves the laboratory’s time and energy by greatly reducing the number of patient results requiring review.
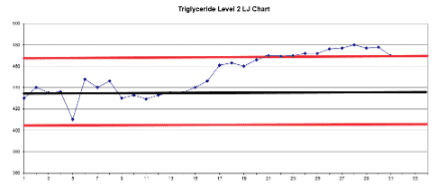
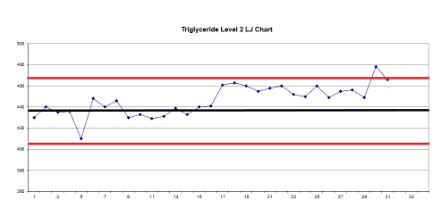
Figure 4 is a Levey-Jennings graph of the same control, but in this case, the results are not slowly drifting upwards; they shift abruptly upwards on day 17. This could be caused by a bad calibration, or a change in reagent lot.
As with the previous example, a daily review of QC would not uncover a problem until the out-of-range result at the end of the month. Plotting the results out on a graph in this way allows for a holistic review of quality control performance, alerting staff to problems before patient results are in question.
The laboratory’s technical consultant is responsible for weekly and monthly review of quality control records, although this task may be delegated to other qualified and appropriately trained personnel.
Train Staff to Assess Quality Control and Implement Corrective Actions
Review of daily quality control results is important to ensure that any out-of-range results are noted and acted upon appropriately prior to continuing with patient testing. Control results that are out of range indicate a possible problem with the test system, meaning that patient results may not be accurate.
All staff who regularly run quality control should be trained to review the daily run results and determine their acceptability prior to running patient specimens. The laboratory’s quality control policy should clearly describe the parameters for accepting or rejecting a QC run. Many instruments will flag out-of-range QC results for review, and testing personnel must recognize these flags and perform appropriate corrective actions. In cases where the testing is done manually, or an instrument is not programmed to flag out-of-range QC results, testing personnel must have a way to refer to the acceptable range for the current lot of control material.
A laboratory should have a well-detailed plan instructing personnel how to proceed when a QC run fails. Corrective actions for QC failure can vary depending on the specific test and system involved. Below are examples of corrective actions to take:
- Mix the control well according to the instructions, and repeat the control.
- Open or reconstitute a new vial of control material and run it.
- Check instrument reagents for expiration dates or visible contamination. Change reagents and then repeat the control.
- Confirm that all maintenance procedures for the instrument are up-to-date. Perform any missed maintenance as necessary.
- Consult the instrument manual for troubleshooting steps prior to repeating QC again.
- Consider whether recalibration may be necessary.
It is also helpful to look deeper into the specifics of the failed QC. Did one analyte fail over all three levels of a control set? That pattern indicates a likely instrument problem. Did one level of a control set fail for all analytes? That is more likely to be a problem with that one vial: It may not have been well mixed or the instrument may have picked up a bubble when sampling.
Maintaining a QC action log detailing failed QC runs and the corrective actions performed to correct them is an excellent way to find patterns and solve persistent problems at their root. For example, if the low control is often out of range while the normal and high are acceptable, there may be a need to verify calibration at the low end of the reportable range. If the QC log shows that high and low vials of QC are often inadvertently swapped, causing QC to fail, perhaps a better system could be implemented for telling the vials apart, such as colored tape on the vials.
Proactive Approach
Being proactive about quality control by setting meaningful acceptable limits and performing regular reviews for long-term trends will lead to consistently reliable laboratory results. Manufacturer’s acceptable quality control ranges are just that: acceptable. In many cases, there is room for a laboratory to go beyond “acceptable” and provide more accurate results over time. In addition, a holistic review of QC results and insightful analysis of failed QC runs and patterns can lead to long-term improvements and the correction of underlying issues hampering a laboratory’s ability to operate efficiently and effectively.
ABOUT THE AUTHOR
Jennifer MacCormack is COLA’s technical writer, developing webinars, technical bulletins, and educational materials, as well as articles for external publication. Prior to joining COLA as a technical advisor, she had more than 15 years of experience as a medical laboratory scientist, working in hospital core laboratories and transfusion services in both the U.S and Canada. She also worked in development and manufacturing of blood typing antisera. Her work has been featured in several industry publications and science communication blogs.
REFERENCES
[i] 42 C.F.R. § 493.1256 – Standard: Control Procedures.
[ii] Westgard, J. O. QC – The Calculations. Westgard QC. Retrieved October 1, 2022, from https://www.westgard.com/lesson14.htm
[iii] Westgard, J. O. QC – The Levey-Jennings Control Chart. Westgard QC. Retrieved October 1, 2022, from https://www.westgard.com/lesson12.htm


