
An AACC program aims at improving laboratory QC practices
By Steve Halasey
Clinical laboratorians recognize that the regular performance of appropriate quality control (QC) practices is an essential underpinning of laboratory medicine. Physicians rely on the results of laboratory testing to guide their decisions about patient therapies, and they depend on labs to verify the accuracy of those results through the implementation of established QC parameters. But keeping up with the QC practices appropriate for a variety of ever-advancing technologies can be difficult, especially when the standards and guidelines for performing QC activities are also subject to continual revision and updating.
To make it easier for laboratorians to overcome such challenges, the American Association for Clinical Chemistry (AACC) has recently launched an online continuing education program, “Practical Approaches to Quality Control in the Clinical Laboratory,” which is focused on guiding practicing clinical laboratorians through the principles and applications of good statistical QC practices.
Courses in the program aim to explain how QC works, to identify and discuss the testing errors that interpretive rules are designed to detect, and to recommend appropriate investigational strategies for resolving QC failures. The courses minimize instruction devoted to mathematical and statistical theory, instead placing emphasis on practical and implementable QC techniques, together with explanations about why specific practices are recommended. The program comprises seven courses on the following topics:
- Overview and basic principles of quality control.
- Establishing QC parameters for a test procedure.
- Using QC to assess the performance of a test procedure.
- Frequency to measure QC samples.
- Responses to out-of-control situations.
- Review of QC data.
- External quality assessment and proficiency testing.
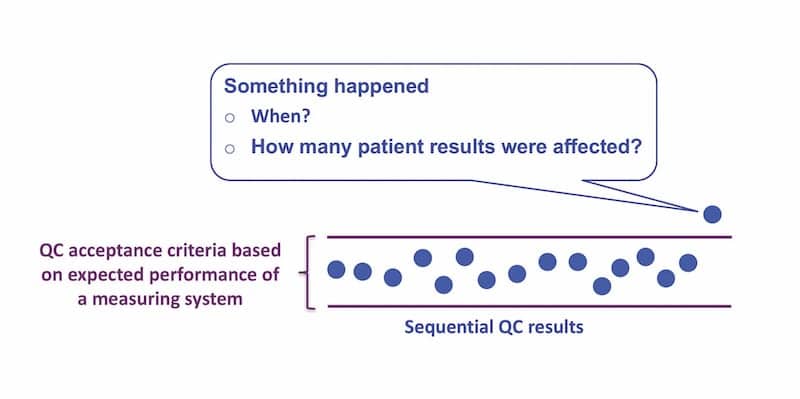
Figure 1. The QC process is intended to confirm that a measuring system is stable and to detect when a defect has occurred that could affect the usefulness of patient results for making medical decisions.
Each course can be completed online in approximately 1 to 2 hours, and includes a lecture, slides and transcripts, and a quiz. Some of the courses also provide a list of recommended readings for further study. Program participants are able to ask questions or provide comments by using the program’s discussion board.
The content of the program is geared primarily toward supervisors, managers, and technologists in clinical laboratory settings. Trainees in laboratory medicine and laboratory directors may also benefit from the program’s courses. Participants who complete the certificate program will be able to:
- Apply appropriate statistical QC practices to monitor the performance of test procedures.
- Select suitable QC materials, and establish reliable target values and control limits.
- Describe common QC directives and implement rules suitable to assess performance and identify errors in a test procedure.
- Determine the appropriate frequency to measure QC samples based on four key QC scheduling practices.
- Establish protocols for responding to QC rules failure.
- Establish protocols for review of QC data and for using the data for quality improvement recommendations.
- Explain how to interpret proficiency testing results to identify test procedure improvement opportunities.

W. Greg Miller, PhD, Virginia Commonwealth University.
“There are a variety of misperceptions about performing quality control and, in particular, how to establish the expected values and the criteria to be evaluated when the control information is telling you that your method isn’t working correctly, or that perhaps there’s some error in the method that needs to be corrected,” says program chair W. Greg Miller, PhD, DABCC, professor of pathology at Virginia Commonwealth University. “So what we did in this program is to pull together a very systematic approach to picking the materials, determining the targeted values, determining the assessment criteria, and determining what to do when QC indicates there’s a method problem. We tried to put all that into a very systematic approach that would not be particularly burdensome to laboratories, and yet enable them to implement best practices.”
Upon successful completion of the program, participants are awarded an online certificate and recognized on the program’s webpage. While the program does not lead to board certification, participants who complete the program should list their certification in the education section of their resumes or curricula vitae.
Core Principles
The program leads off with a course providing an “Overview and Basic Principles of Quality Control,” presented by Miller. After providing an introduction to the basic terminology and statistical characteristics of a QC sample, Miller describes the need for a laboratory’s QC procedures to be fit for their intended use in clinical care, and offers a discussion of the sources of total error—including bias, imprecision, and sample-specific influences—that can render a measurement procedure unsuitable for use.
[reference float=”right”]
QC Program Faculty
In cooperation with the management sciences and patient safety division of the American Association for Clinical Chemistry (AACC), the expert faculty and educators listed below contributed to the development of AACC’s seven-course program, “Practical Approaches to Quality Control in the Clinical Laboratory.”
- Greg Miller, PhD, DABCC (Program Chair)
Professor of Pathology
Virginia Commonwealth University - Nikola A. Baumann, PhD, DABCC
Assistant Professor of Laboratory Medicine and Pathology
Mayo Clinic - David G. Grenache, PhD, DABCC, FACB
Clinical Professor of Pathology, University of New Mexico
Chief Scientific Officer and Core Lab Scientific Director, TriCore Reference Laboratories - Laura Parnas, PhD, DABCC, FACB
Senior Scientific Affairs Manager
Roche Diagnostics - Curtis Parvin, PhD
Manager of Advanced Statistical Research
Bio-Rad Laboratories
The program is supported by Bio-Rad Laboratories, Hercules, Calif, which is also offering complimentary access to the program for a limited time. Participants who successfully complete the program will earn 10 Accentcontinuing education credits and a certificate of completion. To obtain the promotional code for free access to the program, laboratorians should contact their Bio-Rad representative. The program price without the Bio-Rad promotional code is $400 for non-AACC members and $200 for AACC members.
[/reference]
“It’s very important to recognize, when we’re talking about using QC with measurement procedures, that QC cannot improve the performance characteristics of a measurement procedure,” says Miller. “If a measurement procedure is considered inadequate for clinical use, you can only improve it by implementing a better procedure. However, the frequency to perform QC and the acceptance criteria for QC may be adjusted based on how well a measurement procedure satisfies the medical requirements.”
Commenting on the goals of the AACC program as a whole, Miller observes that there is a need to provide a basic understanding and guidance in how to practice quality control (Figure 1).“Quality control practices have been used in clinical laboratories for many decades; so they’re not new, and most people who work in the field have had some training in how to perform QC procedures,” says Miller. “What we’ve done with this program is to pull together best practices derived from the experience of the faculty. We’ve also incorporated protocols from the recently updated document on quality control from the Clinical and Laboratory Standards Institute (CLSI).1 Most of the program’s content reflects the recent recommendations of the CLSI document.”
In his overview course, Miller also devotes a segment to explaining the factors that go into estimating the medical requirements for a specific laboratory test, starting with the recommendations of a conference held in Stockholm in 1999. That conference, Miller says, “outlined the principal ways we address medical requirements: we can base them on clinical outcomes, clinician expert opinion, biological variability, professional guideline recommendations, the recommendations of accrediting agencies, and general measurement capability.” A 2014 follow-up conference sponsored by the European Federation of Clinical Chemistry and Laboratory Medicine updated the approaches for determining the performance requirements for laboratory tests.2
When clinical outcome studies are available, this is the best approach, says Miller. However, there are very few clinical outcome studies that link measurement performance to clinical outcomes. “Much more frequently used is clinician expert opinion and professional guidelines that describe measurement procedure requirements,” he says. “These guidelines are usually based on surveys of practitioners, expert opinion, and, when available, clinical outcome evidence. This is probably the most practical approach when we do have any professional guidelines we can rely on.”
Miller also devotes a section of his presentation to explaining relative change value (RCV), a statistic derived from biological and analytical variation data that is often calculated to estimate the magnitude of change in a test value that should be considered clinically meaningful.
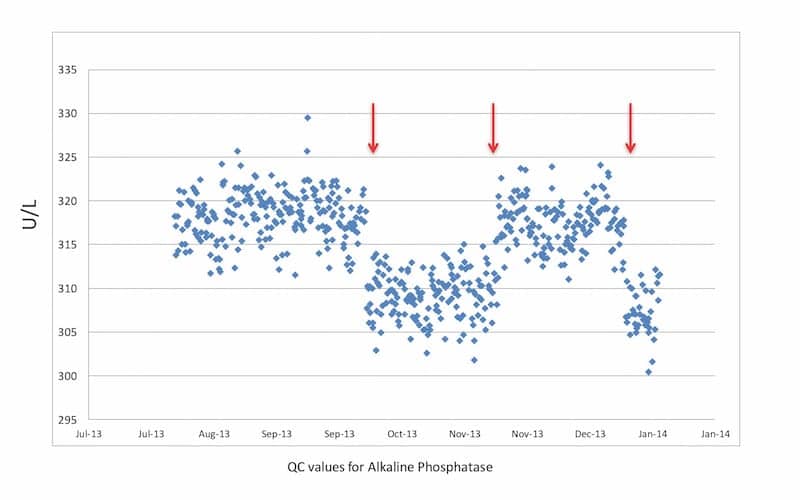
Figure 2. Sample QC values for alkaline phosphatase, showing a change in QC values caused by a change in water source (arrows).
Miller says that the techniques presented in the program’s courses are not particularly difficult to perform, but “the challenge is performing them appropriately.” For example, in many situations laboratories bridle at the extra cost of performing more than the minimum of QC testing required under the Clinical Laboratory Improvement Amendments of 1988—even when that minimum is clearly not adequate. “In this program we make it clear that labs must decide how frequently to perform QC based on the stability characteristics of their measurement procedures and the risk of harm if they report an incorrect result but don’t know about it for some number of hours.”
From the laboratory’s point of view, says Miller, the key job is to make sure that its QC system is sufficiently robust to identify a problem immediately after it occurs, so that staff are in a position to take corrective action (Figure 2). “This is probably one of the biggest challenges for laboratories that are producing results continuously 24 hours a day, which is the case for a fairly substantial number of tests. So we tried very hard to provide guidance about how to make judgments in areas that might implicate a risk of harm to patients, and especially for elements of the QC plan such as the frequency and number of controls to run, and when to run them,” says Miller.
QC Parameters
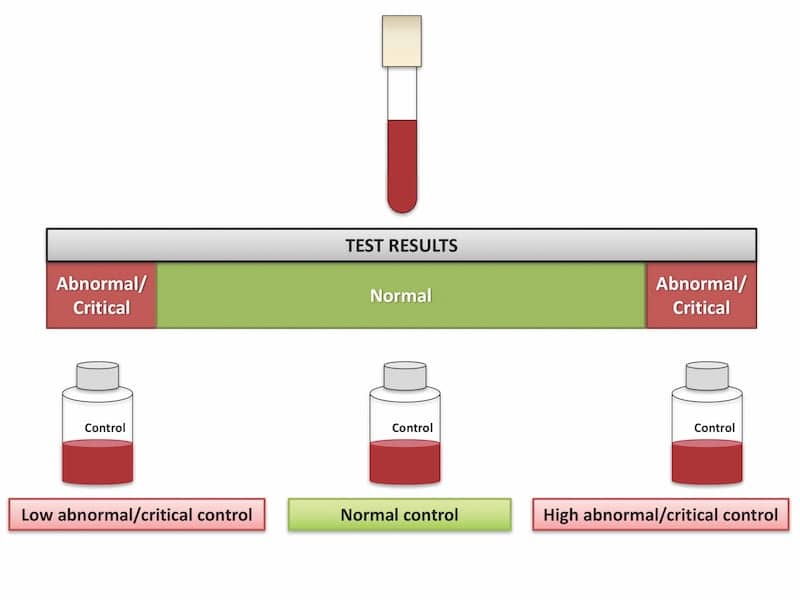
Figure 3. Liquid or lyophilized QC materials are used to simulate clinical samples during QC testing. On a daily basis, laboratories run tests with QC materials of known concentrations, including at least a normal control and a control at a high or low concentration relative to medical decision levels.
In the second course of the series, “Establishing QC Parameters for a Test Procedure,” instructor M. Laura Parnas, PhD, DABCC, FACB, senior scientific affairs manager at Roche Diagnostics,begins by describing a number of factors that laboratorians should consider when selecting QC materials, which are used to simulate clinical samples during QC testing. On a daily basis, laboratories run tests with QC materials of known concentration in the same manner as patient specimens, in order to confirm that their system’s performance is within established parameters (Figure 3). QC materials are commercially available in liquid or lyophilized form, notes Parnas, and they are usually packaged in bottles that allow for routine use.
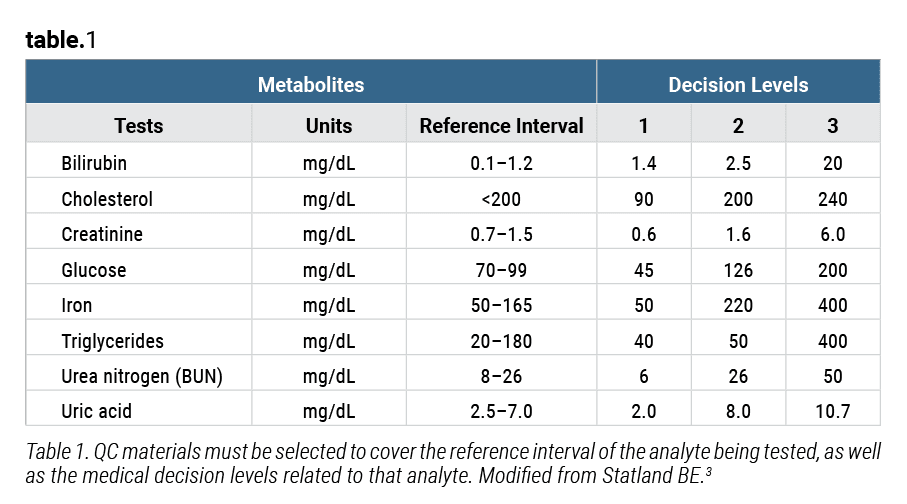
Table 1. QC materials must be selected to cover the reference interval of the analyte being tested, as well as the medical decision levels related to that analyte. Modified from Statland BE.3
“QC materials can be obtained from the same manufacturer as the equipment and/or reagents that the laboratory uses, or they can be purchased from third-party vendors that specialize in the production of quality control materials,” says Parnas.
“The goal,” Parnas observes, “is to have QC materials that perform in a similar manner to real samples.” Considerations to take into account when selecting a QC material for a particular assay include its matrix, stability and homogeneity, and analyte concentration relative to medical decision levels (Table 1). Parnas provides details about each of these factors as they apply to both selection and daily use.

M. Laura Parnas, PhD, Roche Diagnostics.
Parnas’ course also discusses how laboratories should go about establishing mean and standard deviation control values, so that the variability of a test can be measured and expressed in relation to known values. Control values established for an assay should “reflect the imprecision expected of the method, and include all possible sources of variability during an extended period of time,” says Parnas. Sources of short- and long-term variability to be taken into consideration include multiple operators; planned and unplanned maintenance events; environmental effects; different lots of reagents and calibrators; calibration cycles; and the normal deterioration of reagents, calibrators, and QC materials.
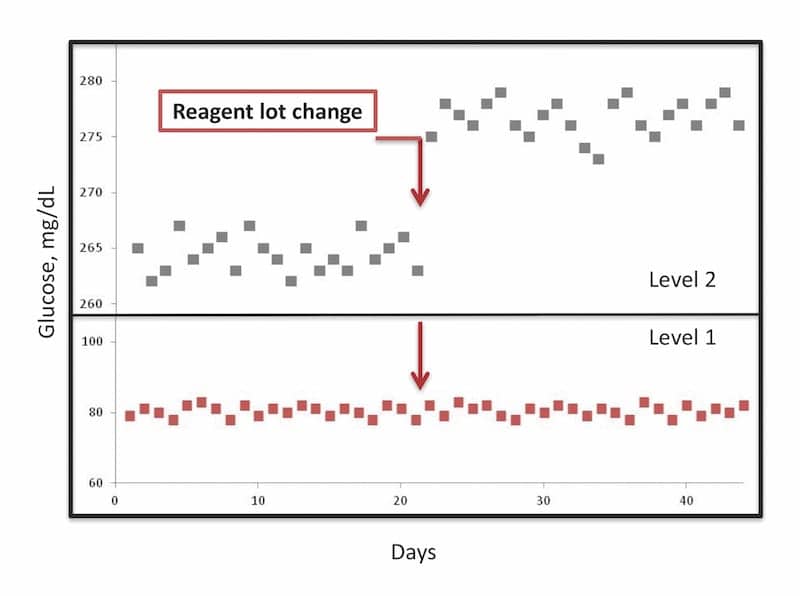
Figure 4. A reagent lot change can cause a change in value for the QC result (top) without any corresponding change in the value of a patient result (bottom). In such a situation, the lab needs to change the target value of its QC result and base its decision about whether the new reagent lot is acceptable on the patient results, which should be measured with both the old lot and the new lot.
The course ends with a discussion of how laboratories should evaluate the performance of their systems after a change in reagent lot, which can bring about ‘matrix effects’—unexpected changes in QC values that may not be reflected in patient test results (Figure 4).
“Because of these matrix effects, the QC results may not be a reliable indicator of the method’s performance when testing patient specimens after a reagent lot change,” Parnas cautions. “Careful lot-to-lot comparison (also known as reagent crossover) studies using patient samples are needed before switching to a new lot of reagent.”
Assessing Test Performance
In the third course of the series, “Using QC to Assess the Performance of a Test Procedure,” David G. Grenache, PhD, DABCC, FACB, clinical professor of pathology at the University of New Mexico, and chief scientific officer and core lab scientific director at TriCore Reference Laboratories, begins with a discussion of the role of QC rules in maximizing error detection while minimizing false rejections. “Ideally a QC rule would never be violated when the method is performing properly, and it would always provide an alert when an error occurs,” says Grenache. “However, QC rules aren’t perfect, and so some measurement procedure results will be falsely rejected while others will be falsely accepted.
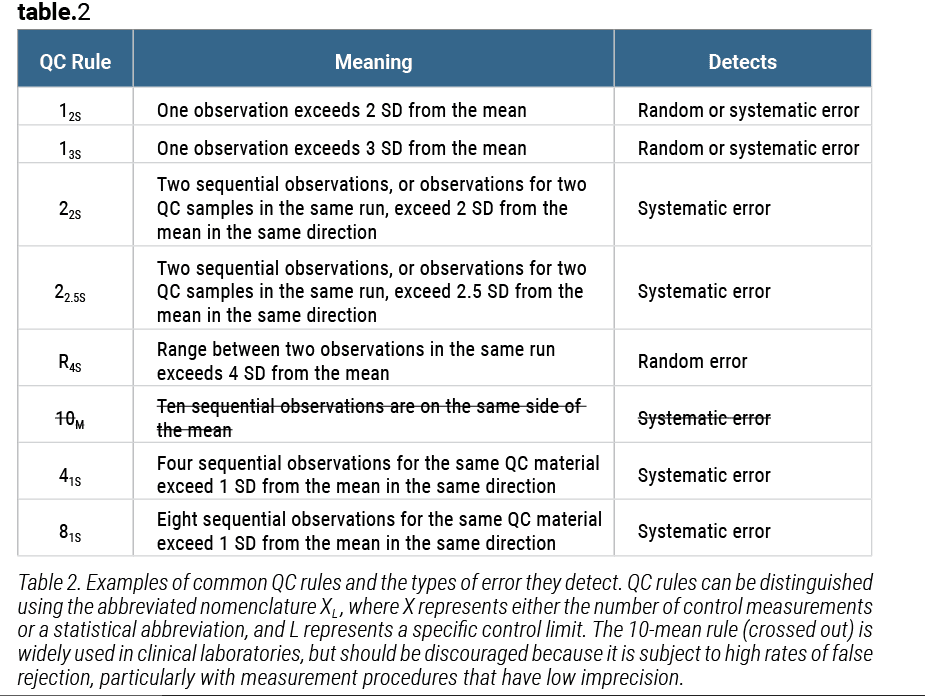
Table 2. Examples of common QC rules and the types of error they detect. QC rules can be distinguished using the abbreviated nomenclature XL, where X represents either the number of control measurements or a statistical abbreviation, and L represents a specific control limit. The 10-mean rule (crossed out) is widely used in clinical laboratories, but should be discouraged because it is subject to high rates of false rejection, particularly with measurement procedures that have low imprecision.
“Each QC rule has its pros and cons,” Grenache adds. “For example, the 10-mean rule [10 sequential observations on the same side of the mean] is widely used in clinical laboratories, yet because it is subject to high rates of false rejection, particularly with measurement procedures that have low imprecision, its use is often discouraged” (Table 2).
Grenache notes that the AACC program as a whole offers an important directive for laboratory practices. “Despite an abundance of resources intended to inform what constitutes best practice, QC practices vary considerably across laboratories,” he says. “I have observed that seminars and educational lectures on quality control topics are of great interest to the laboratory community. It was our hope that the QC certificate program would provide additional education on the topic of quality.”
Grenache devotes the majority of his presentation to an explanation of various QC rules and tools for selecting rules appropriate to particular laboratory tests. He explains application of the multirule approach, and introduces power function graphing as a means for identifying which rules a laboratory should select. The presentation also covers the application of sigma metrics to determine whether a particular QC strategy is appropriate for the performance capability of a method relative to clinical use of the test results, and demonstrates cumulative sum and exponentially weighted moving averages as methods for detecting trends that represent systematic errors.

David G. Grenache, PhD, University of New Mexico, TriCore Reference Laboratories.
“Most of the techniques described in the QC certificate program are relatively simple to implement,” says Grenache. “But keep in mind that contemporary QC practices are best managed with computer technologies that allow for the storage, retrieval, and analysis of QC data. These practices are more difficult to perform without access to those technologies.”
Whatever the capabilities of computerized systems may be, Grenache advises, in-depth knowledge of QC practices is still essential for those who intend to use such tools. “QC modules within a laboratory information system or other QC software solutions should be effectively utilized in order to assist laboratorians in managing QC,” he says. “These management tools are quite effective—but they aren’t perfect. They have to be set up and managed by individuals with a solid understanding of quality control practices.
Scheduling QC
The fourth course of the program takes on the “Frequency to Measure QC Samples,” with instruction provided by Curtis Parvin, PhD,manager of advanced statistical research at Bio-Rad Laboratories.
“QC scheduling can be of two different types,” notes Parvin. “Event-related scheduling involves evaluating QCs at points in time in the testing process when events occur that may cause a change in the process. Examples of such events might be calibration or instrument maintenance. Event-independent scheduling involves deciding how frequently to schedule routine QC testing periodically over time.”
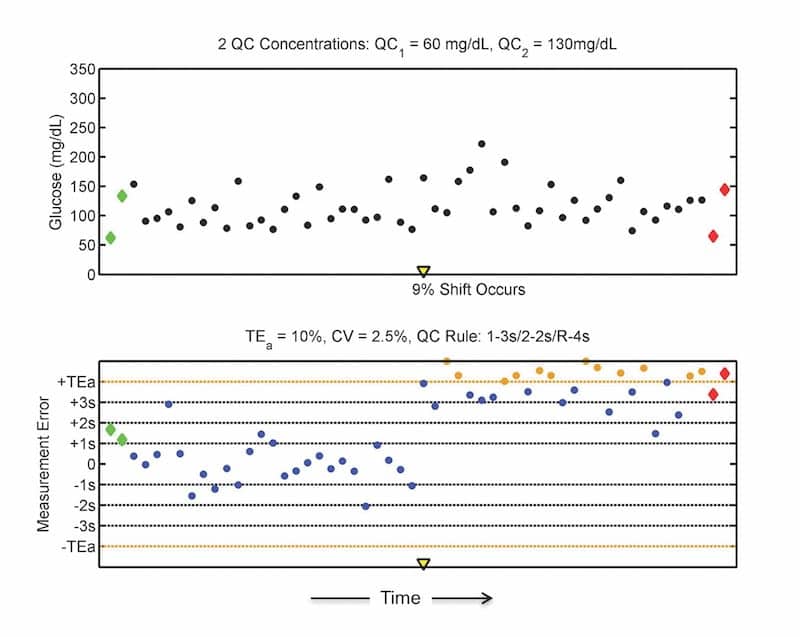
Figure 5. An example of unacceptable glucose testing results after an unexplained shift of 9%, which is difficult to see in the patient results (top), but readily apparent in the QC results for measurement errors (bottom). To determine which patient results were affected, the laboratory must correct the out-of-control condition and retest patient specimens to identify which tests had unacceptably large measurement errors.
When considering routine QC scheduling, Parvin explains, labs can equivalently think about the schedule in terms of the time between QC events, the number of patient specimens examined between QC events, or the number of analyte examinations between QC events. “Scheduling QC in any of these ways is perfectly acceptable. The way a laboratory chooses to define its routine QC scheduling may depend on workflow considerations, or on instrument and laboratory information system capabilities. (For more information, see “With the Chair.”)
“Generally, regulatory requirements for QC testing are based on the maximum time allowed between QC events,” he adds.
The QC schedule adopted by a laboratory has no influence on the probability of a QC rule rejection, Parvin notes. “But it does influence the number of unacceptable patient results that may be produced before the out-of-control error condition is detected by the QC rule” (Figure 5).
Parvin ends his course with a discussion of four scheduling practices that laboratories should consider:
- Always end patient testing with a QC evaluation.
- Seek to make the time between QC evaluations shorter than the time needed to correct results before they are acted on.
- Know the number of patient results between QC evaluations.
- Divide analytes into high- and low-sigma metric groups.
“From the laboratory’s perspective, patient risk is related to the number of patients examined between QC events, not the length of time between QC events,” Parvin explains. “So, while it is perfectly acceptable to schedule QC based on time, it is important for you to know the average (or typical) number of patient specimens that are examined between QC evaluations.”
Keeping Control
The fifth course in the program, “Responses to Out-of-Control Situations,” is presented by Nikola A. Baumann, PhD, DABCC, assistant professor of laboratory medicine and pathology at the Mayo Clinic.

Nikola A. Baumann, PhD, DABCC, Mayo Clinic.
Baumann identifies four steps that laboratories should consider when responding to a QC failure. “The first step is containment,” she says. “This means that when QC is outside of acceptable limits, the lab must immediately stop reporting patient results to contain the possible out-of-control situation. The second step is to verify that the QC failure truly represents an analytical out-of-control situation, or that the QC failure is ‘real.’ The third step is to investigate and troubleshoot. And the fourth step involves recovery; how do we go back in time and determine whether patient results were impacted by the out-of-control situation that just occurred?”
To complete the response to a QC failure, Baumann notes, “regardless of the analytical performance of the method or the performance requirements for medical use, patient retesting must always occur after QC failures.”
Baumann observes that little published guidance is available to help labs take this final step. “In general, the approach we want to take is to start repeat testing from the point in time of the QC failure, and then go back in time until the time that the error occurred. But the question remains: how do we determine the point in time that the error occurred and how many patient samples need to be retested?”
Baumann ends her presentation with an extended discussion of how laboratories can assess the impact of a QC failure on patient test results, and how to determine the number of patient samples that must be retested.
QC Data
Grenache and Baumann team up for the sixth course of the program, “Review of QC Data,” which describes the parameters that should be included in the daily, weekly, and monthly review of a laboratory’s QC data; explains the management of QC for multiple analyzers; and describes how labs can utilize ongoing assessment of their QC program to optimize error detection.
In a series of examples, Grenache demonstrates the different approaches appropriate for reviewing daily, weekly, and monthly QC data. Such reviews can help labs to identify and correct problems in their testing processes, and verify that appropriate corrective actions have been performed.
In one example, he notes, a shift in the QC data was attributed to a change in reagent lots, and was judged not to be a medically important change. “Given that the QC results were stable after the shift, it would be appropriate to consider correcting the value of the target mean,” he says.
But he also adds a word of caution about recalculating and changing target values. “Changing them is not something that should be done without considerable thought. While it may be tempting to change target values in response to QC rule failures, doing so risks masking an analytical problem. One should only consider changing target values when there is clear justification for doing so.”
Documented modifications or changes to a measurement method, or when analytical instruments undergo repairs or part replacements, may be justifiable reasons for changing a target value.
Baumann describes strategies for handling QC for multiple instruments from the same manufacturer performing the same test, where between-instrument variations could result in significantly different test values.
“The end goal is to make sure that results are always clinically comparable, no matter which analyzer the patient sample is tested on,” says Baumann. “The variation between instruments should reflect only analytical variation and has to be monitored to make sure it doesn’t become medically relevant differences. Between-instrument comparisons using patient samples are also useful, and it may be useful to incorporate frequent between-instrument comparisons to complement your statistical QC.”
Closing out this course, Baumann identifies a number of factors that laboratories can review as part of an assessment of their overall QC program. Close review of QC data can enable labs to optimize error detection and devise corrective actions in a timely fashion.
EQA/PT
In the final course of the program, Miller returns to provide a discussion of “External Quality Assessment and Proficiency Testing.”
As its name implies, external quality assessment (EQA) is an assessment performed by an external organization to confirm that a laboratory’s measurement procedures are operating correctly. A regulatory requirement in many countries, EQA supplements the internal control procedures that laboratories use to control their measurement processes. Proficiency testing (PT) is another term for the same type of assessment.
Miller describes the process of performing EQA in a step-by-step fashion, beginning with the samples sent from the external organization: “Samples are received for measurement; those samples are measured in the same manner as are patient samples, they are not to receive any special treatment; the results are reported to the EQA provider just as we report results for patient samples to physicians; the results are evaluated in comparison to other labs measuring the same analyte.” Acceptable results from the EQA process verify that a lab is performing measurements correctly.
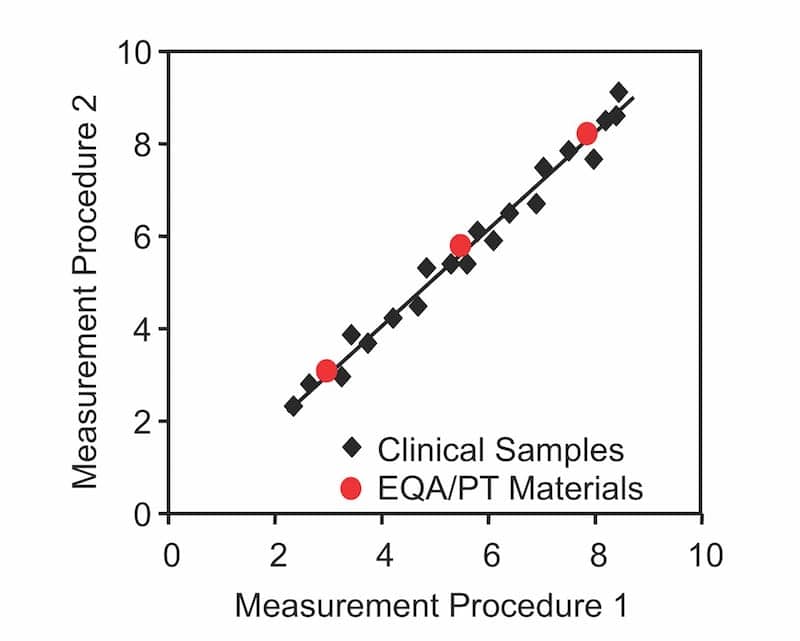
Figure 6. Commutable external quality assessment materials (red dots) have the same relationship to different test methods as is observed for authentic patient samples (black diamonds), regardless of concentrations.
Miller emphasizes that commutability is an important element for EQA materials (Figure 6).A commutable sample is one that has the same relationship between different routine methods as is observed for authentic patient samples, at several concentrations. “Noncommutable EQA materials simply have some other relationship than is observed for the patients when making a comparison between two different measurement procedures.”
Noncommutable samples impose some important limitations, says Miller. “Different methods may give different results for the EQA or PT samples when the results for authentic patient samples are in fact the same. For this reason, the results cannot be used to evaluate the agreement with a reference measurement procedure, the results cannot be used to evaluate the agreement among different routine procedures, and, so, we typically evaluate proficiency testing results against a peer group mean value.”
After a discussion of some weaknesses inherent in peer group evaluation programs for EQA, Miller describes the increasing prevalence of accuracy-based EQA programs over recent years. “Accuracy-based programs use commutable samples—samples that are prepared, for example, as off-the-clot serum with nothing added to them—that are expected to perform exactly the same way as do authentic patient samples.”
Using accuracy-based approaches enables acceptance criteria to much better reflect medical requirements, Miller explains. Such approaches also enable target values to be assigned by a reference measurement procedure, and labs can use them to compare the results from one type of procedure to another. And accuracy-based approaches enable an evaluation of the agreement of results for patient samples among different methods and different labs, providing much more useful information about the performance of a lab’s procedures.
Miller closes his course, and the program, with a discussion of the use of correction factors, which can be used to ensure the consistency of reported patient results across a healthcare system. He adds the cautionary note that some regulatory requirements may not permit the use of correction factors.
Conclusion
According to Miller, thetechniques described in AACC’s seven-course program are intended to give laboratories the basic tools to set up a QC program that’s rationally based on the performance characteristics of their measurement procedures, together with an understanding of the risk of reporting an incorrect result and causing an unfavorable medical outcome.
“Remember, before this program was created, people have been doing QC for a long time, so very little of this is new,” says Miller. “What we think we’ve brought to the table is a very coherent, systematic strategy for setting up and using a QC system in the real world of a laboratory, and dealing with the problems that typical laboratories have to face.”
Steve Halasey is chief editor of CLP.
References
- Statistical Quality Control for Quantitative Measurement Procedures: Principles and Definitions(CLSI Guideline C24), 4th ed. Wayne, Pa: Clinical and Laboratory Standards Institute, 2016. Available at: https://clsi.org/standards/products/clinical-chemistry-and-toxicology/documents/c24. Accessed April 30, 2018.
- Sandberg S, Fraser CG, Horvath AR, et al. Defining analytical performance specifications: consensus statement from the 1st strategic conference of the European Federation of Clinical Chemistry and Laboratory Medicine. Clin Chem Lab Med. 2015;53(6):833–835; doi: 10.1515/cclm-2015-0067.
- Statland BE. Clinical Decision Levels for Laboratory Tests.2nd ed. Oradell, NJ: Medical Economics Books, 1987. Available at: www.westgard.com/decision.htm. Accessed May 1, 2018.


how can i apply for this course